Archive: 2012

I can’t teach my course on family sociology without these graphs, which show the rise of the unfree population, and the incredible race/ethnic and gender disparities behind them.

The Bureau of Justice Statistics has released Correctional Population in the United States, 2010, which updates my standard figures. First, the total trend toward unfreedom in the population — from less than 2 million in 1980 to more than 7 million 30 years later:

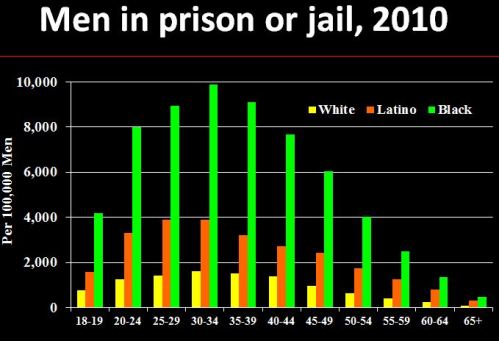
And second, to understand the disparate impact of this change on Black men in young adulthood primarily — and secondarily, Latino men — here are the rates of incarceration for men by age and race/ethnicity (Blacks here exclude Latinos; Asians and American Indians are not included in the statistics):

Just to make sure you read the scale right, that incarceration rate for Black men in their early 30s is 9,892 per 100,000, or 9.9%, or one-in-ten — more than five-times the rate for White men.

I come at this largely from its effects on families. In a nutshell: The overall trend is largely a consequence of how the U.S. has waged its drug war over this period; these policies fit into a web of practices that deny families to millions of people in the U.S. (only a minority of whom have been convicted of crimes), including by simply removing men from communities and increasing the number of single-parent families.

All that said, you may notice the little decline at the end of that long upward trend in the first figure. In fact, for the first time since 1980, there has been a decline in the incarcerated population for two years running. There has been a long-term decline in crime, but I don’t know whether that is more important than the budget crises facing so many states, or the diminished lust for locking people up. In New York, for example, seven incarceration facilities were closed in the last year, after the number of prisoners dropped about one-fifth in the past decade:

The inmate decline followed a 25 percent statewide drop in crime over the past decade and revisions in sentencing laws that allowed earlier releases and alternative programs for nonviolent drug offenders. The number of prisoners in medium-security prisons declined almost 20 percent from 2001 to 2010 while those in minimum-security facilities dropped 57 percent.

The numbers on the charts are still off the charts, meanwhile — and remember these are just those in the system now. Many more people (and their families) live lives permanently hampered by criminal records and the experience of imprisonment.

Tara B. drew my attention to a New York Times article on economic mobility in the U.S. and Europe. This chart compares intergenerational mobility in the U.S. and Denmark, showing where men raised in each quintile of the population (based on income) end up as adults (lighter bars = Denmark, dark bars = U.S.):

For both countries, there is more movement in the middle of the income distribution than at the extremes. However, there are important differences. As we see, in the U.S. men whose dads were in the bottom fifth in terms of income are much more likely to remain in the bottom earnings tier than men in Denmark are, with over 42% experiencing no mobility. We also see that they are less likely to move to the highest levels of the income ladder than are their Danish equivalents. However, this is partially due to differences in the overall distribution in income; because there is more income inequality in the U.S., an individual would have to gain much more income to make it from the lowest to the highest quintile than would someone living in Denmark, where the income distribution is more compact.

The full article from which this data is drawn, “American Exceptionalism in a New Light: A Comparison of Intergenerational Earnings Mobility in the Nordic Countries, the United Kingdom and the United States,” is available for free here.

While most Americans think of the witch as a possibly evil character associated with Halloween in the U.S., many Italians would see a motherly figure who keeps a clean house (hence the broom) and gives candy or coal to children.  The character’s name is Befana.  Thanks to Katrin for drawing my attention to her.

Italians celebrate the end of the Christmas season today,  January 5th.  Tonight is the night before the Feast of the Epiphany (celebrating the understanding that Jesus was God in human form) (source).  According to Italian mythology, Befana will visit children’s homes, filling their shoes with candy (if they’ve been good) or coal (if they’ve been bad) (source). Epiphany Eve is celebrated throughout Italy.

For more examples of variation in the culture of Christmas, see our posts on Krampus: Santa’s Evil Side KickThe ChristKind, Snegurochka: Santa’s Granddaughter, and Black Pete (trigger warning for blackface).

Lisa Wade, PhD is an Associate Professor at Tulane University. She is the author of American Hookup, a book about college sexual culture; a textbook about gender; and a forthcoming introductory text: Terrible Magnificent Sociology. You can follow her on Twitter and Instagram.

Cross-posted at Jezebel.

Yesterday I posted about U.S. immigration trends, updated through 2010. Following up on that, Dolores R. found another immigration-related post by KPCC…this time, a look at the wait time to get a family-sponsored immigration visa. With the removal of strict, racialized quotas in 1965, the U.S. turned to a policy based on a set of priorities for deciding who would be granted a visa; among the various categories was a preference for those who had sponsoring relatives already living in the U.S., with different visas and priorities based on family relationship:

  • F1 = unmarried adult children of U.S. citizens
  • F2A = spouses and children (under age 21) of permanent residents
  • F2B = unmarried adult children of permanent residents
  • F3 = married adult children of U.S. citizens
  • F4 = siblings of adult U.S. citizens

According to the U.S. State Department, the annual minimum family-reunification visa target is 226,000 (note that this excludes spouses, parents, and minor children of U.S. citizens, who are highest priority for immigration and are exempt from immigration caps). The Immigration and Naturalization Act requires that family-sponsorsed (as well as employer-sponsored) visas be granted in the order that eligible potential immigrants applied. Unsurprisingly, many years there are more eligible applicants than there are available visas, leading to a backlog of individuals who qualify to immigrate but are waiting for a visa to become available. In particular, China, Mexico, India, and the Philippines are “oversubscribed,” meaning there is a significant backlog.

How long? The table below shows the cut-0ff date for visa applicants in each category as of January 2012. That is, the dates given here are the date by which a person had to apply to finally have a visa available this month; the 2nd column shows for all areas excluding the four countries singled out because of their particularly long wait times:

The least oversubscribed visa category is the F2A, where those now receiving visas will have waited a bit under 3 years. But look at some of the other dates listed. For F1, F2B, and F3 visas from Mexico, the people now at the head of the line have been waiting nearly two decades, having applied in 1992 or early 1993. F4 applicants from the Philippines have been waiting almost a quarter century, since 1988.

This is part of the reason why undocumented immigration continues, and arguments about fairness and waiting their turn in line may not be particularly compelling to individuals who want to reunite with family members in the U.S. Waiting a year, or two, or five, may seem reasonable. If you learn there’s a 20-year wait, the cost/benefit analysis of whether to wait for the visa to come through or to find other means may shift significantly, regardless of how otherwise law-abiding a person might be.

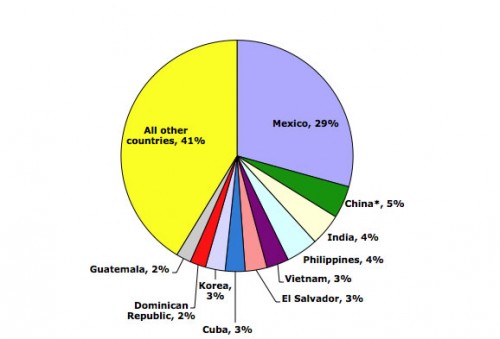
Dolores R. let us know that the Migration Policy Institute has a bunch of updated data and charts/graphs illustrating immigration trends in the U.S. through 2010 (via the KPCC website). So, in 2010, where did immigrants to the U.S. come from? As you may expect, the single largest source of immigrants was Mexico:

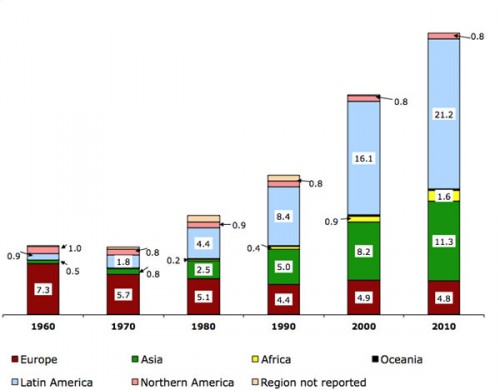
Looking at the region of birth of immigrants in the U.S. (in millions) over time reveals clear patterns:

Notice the shift over time, with fewer immigrants coming from Europe (red) but a major increase in the number of immigrants from Asian and Latin America (green and light blue), noticeable already by 1980. This reflects changes to U.S. immigration policy in 1965 that got rid of the old quota system that openly favored northern and western Europeans. The result was a major change in the demographics of U.S. immigrants.

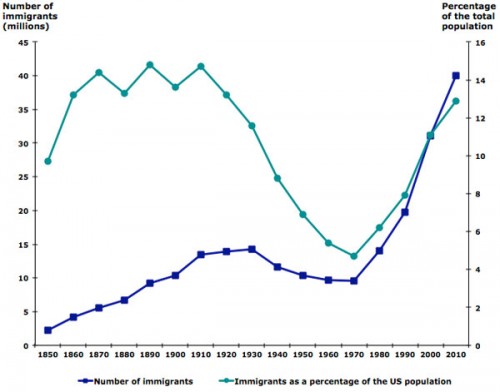
As of 2010, immigrants made up about 13% of the total U.S. population — the highest level in decades, but still not at the all-time high levels seen at several points in the late 1800s/early 1900s:

Lots more data at the MPI website, including a map where you can get very detailed information about the foreign-born population for each state. You might also want to check out our posts on U.S. immigration and geographic names, an interactive map of immigrant settlement patterns, English acquisition among U.S. immigrants, and a map of concentrations of speakers of various languages in the U.S.

Cross-posted at Citings and Sightings.

In an interview discussing whether teen sleepovers can actually prevent teen pregnancy, CNN’s Ali Velshi says flatly, “This is a little bit counter-intuitive.” But as his interviewee, UMass sociologist Amy Schalet (who wrote on this subject in Contexts in “Sex, Love, and Autonomy in the Teenage Sleepover” in the Summer of 2010), explains:

Let me clarify: it’s not a situation where everything goes… It’s definitely older teenage couples who have established relationships and whose parents have talked about contraception.

Which is to say, as Velshi puts it, sex and sex education in countries like the Netherlands, in which parents are more permissive—or as Schalet says, “parents are more connected with their kids”—about allowing boyfriends and girlfriends to sleep over, take “a holistic approach.”

Schalet’s research, explored more deeply in her new University of Chicago book Not Under My Roof, takes a look at American parenting practices surrounding teen sex and the practices of parents in other countries. Using in-depth interviews with parents and teens and a host of other data, she finds:

The takeaway for American parents… isn’t necessarily “You must permit sleepovers.” Many parents are going to say, “Not under my roof!” That’s why it’s the title of my book. The takeaway is that you can have more open conversations—you should probably have more open conversations—about what’s a good relationship, sex and contraception should go together, what does it mean to be “ready,” how to get rid of some of these damaging stereotypes (gender stereotypes). Those are all things that are going to help promote teenage health and better relationships between parents and kids.

Schalet is clear that parental approaches are nowhere near the only factor in the stark differences in teen pregnancy rates between the U.S. and the Netherlands, but says they are, in fact, particularly important. “Kids are having sex, clearly,” Velshi says. And that’s precisely the point, no matter whether parents believe their kids should be able to have sex in their own homes, Schalet believes: “I think what you emphasize is that, above all, the conversation is important, and the conversation itself does not make kids have sex.” Ideally, she points out, that conversation will take place at home with parents, but a holistic talk about sexuality, relationships, and health can also take place in schools, with clergy, and in many other locations.

Dr. Schalet on CNN (we apologize for the commercial):

Amy Schalet’s new book is Not Under My Roof: Parents, Teens, and the Culture of Sex.

—————————

Letta Page is the Associate Editor and Producer of The Society Pages. She has a decade of experience in academic editing across a range of disciplines, including two years as the managing editor of Contexts. Page holds degrees in history and classical studies from Boston University and an art degree from the University of Minnesota.

If you would like to write a post for Sociological Images, please see our Guidelines for Guest Bloggers.

Since its release in November, Get Up!’s commercial supporting gay marriage in Australia has garnered substantial social media interest (over four million views on Youtube). The U.S. LGBT news magazine The Advocate called it “possibly the most beautiful ad for marriage equality we’ve seen” (source). Take a look:

From a sociological point of view, what is interesting about this ad is how it avoids the powerful, but charged language of equality and rights. Supporters of same-sex marriage typically frame their cause in terms of non-discrimination (“all people are equal”), non-interference or privacy (“how is my gay marriage affecting yours?”) or in terms of freedom of speech (“I should marry who I want”). See images of posters using this frame here and here.

Rights language such as this, however, comes with the potential of conflicts and trade-offs. Accordingly, opponents of same-sex marriage have often capitalized on this in their responses. This poster, for instance, expresses a fear or mockery of assertive, unbridled individualism. Posters with this frame here.

 This “Yes to Proposition 8” video is another good example. In it one woman claims that, if gay marriage is legal, her religious identity will be subject to discrimination and her freedom to speech will be contested.

The language used by the marriage equality movement, then, enables its opponents to re-frame their responses in the same type of language.

This is why the Get Up! commercial is a game changer. Instead of using “rights talk,” it keeps both words and slogans to a minimum. It uses visuals to embed the couple in a network of family and friends.  At the end, for example, the camera steps back to show not just the couple but a wider network of people who happily witness a marriage proposal. This approach implicates the happiness of not just two individuals, but a community.  The message is that gay marriage is not just about individual rights, but about collective celebration and social recognition.

—————————

Ridhi Kashyap is a researcher in the Migration Group at the Institute for Empirical and Applied Sociology in Bremen, Germany. She studied interdisciplinary social sciences at Harvard University, and was a human rights fellow there after graduating in 2010. She is actively interested in human rights, particularly as they implicate issues of gender, migration, and development.

If you would like to write a post for Sociological Images, please see our Guidelines for Guest Bloggers.


Lisa Wade, PhD is an Associate Professor at Tulane University. She is the author of American Hookup, a book about college sexual culture; a textbook about gender; and a forthcoming introductory text: Terrible Magnificent Sociology. You can follow her on Twitter and Instagram.

Cross-posted at Reports from the Economic Front.

Here is a short (less than 4 minute) video that illustrates the fact that 53% of our tax dollars, conservatively estimated, go to finance our military.

And here is a link to a recent study by Robert Pollin and Heidi Garrett-Peltier on the employment effects of military spending versus alternative domestic spending priorities, in particular investments in clean energy, health care, and education.

The authors first examine the employment effects of spending $1 billion on the military versus spending the same amount on clean energy, health care, education or tax cuts.  The chart below shows their results.

defense.jpg

Moreover, even though jobs in the military provide the highest levels of compensation, the authors still find that “investments in clean energy, health care and education create a much larger number of jobs across all pay ranges, including mid-range jobs (paying between $32,000 and $64,000) and high paying jobs (paying over $64,000).”

Let’s see if these facts come up in the next Congressional budget debate.