
This graph shows the total number of people allowed into the U.S. under refugee status since 1983, by region of the world:
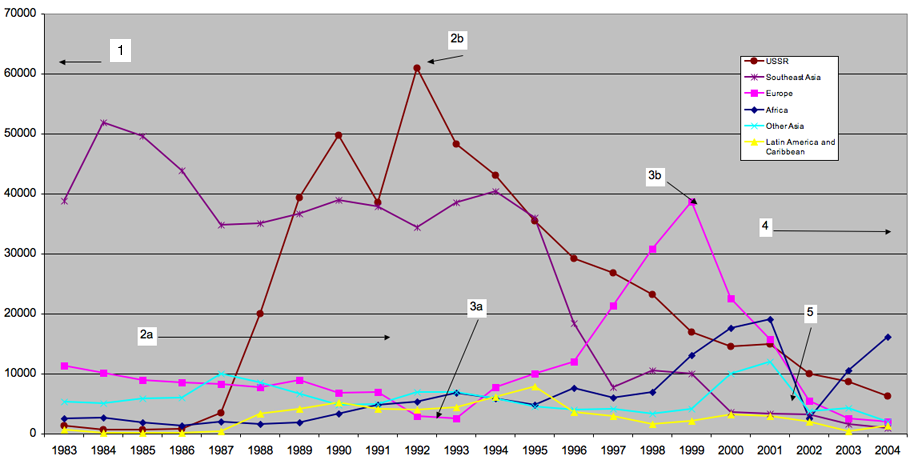
Here is the key to the numbers on the graph (found here):
*Refers to fiscal years with the exception of 2004, for which data ends in June.
1. Large Cuban and Indochinese waves of refugees, prior to 1983
2a. Cold War period, Glastnost/Perestroika, 1985-1991
2b. Soviet Union dismantled, December 1991
3a. Balkans period: Break-up of Yugoslavia, 1992
3b. Balkans period: Expulsions of ethnic Albanians in Kosovo, 1998
4. Civil conflict period: Somalia, Sudan, Liberia, Ethiopia, late 1990s-present
5. Terrorist attacks of September 11, 2001
Authors’ tabulation of ORR data.
This map shows U.S. cities with the largest numbers of refugees resettled there:
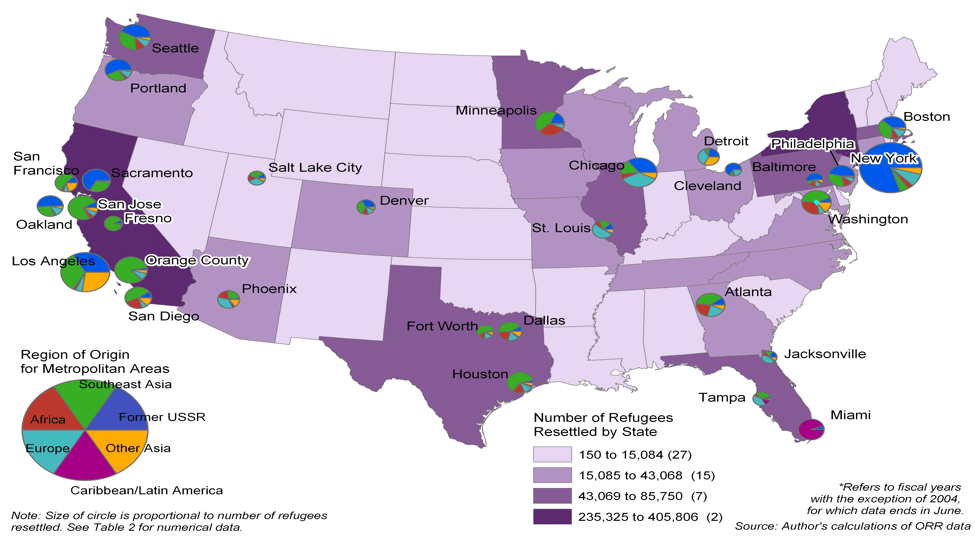
Both of these images were found following links in this essay at Migration Information Source.
Comments 3
somalia map — November 18, 2008
[...] Union dismantled, December 1991 3a. Balkans period: Break-up of Yugoslavia, 1992 3b. Balkans periodhttp://thesocietypages.org/socimages/2008/11/12/refugee-resettlement-in-the-us/Somalia: Geography, Maps and InformationGeography and maps of the African country of Somalia. ... A [...]
Michael Kagan — December 17, 2008
Readers of this blog may be interested in a column I wrote recently for the Seattle Post-Intelligencer, calling for a revitalized US refugee resettlement program, and the creation of a USA Refugee Corps. You can read the column here: http://seattlepi.nwsource.com/opinion/391195_refugees09.html
If you like what I am proposing, then you can give it a boost in its chances of being considered by the new administration by voting here:
Just follow these steps:
1) Join Change.org at https://www.change.org/admin/sign_up
2) Vote by going to: http://www.change.org/ideas/view/usa_refugee_corps_-_export_hope_and_revitalize_our_national_moral_standing
You should see your vote register and the number of votes go up! If you don't see that happen, try voting again.
Mike Kagan
Jose Montalban — March 25, 2009
I am the son of immegrants. My parents had to work from the bottom up. These people get everything handed to them. The ones from Africa are violent, and think everything should be handed to them like the blacks in this country. I am all for eastern europe, asian, and south american refugees coming here, but let Africa take in ther own warring neighbors!