How to go from inspiration to design?
There are plenty of great graphic designers plastering walls with posters, filling magazines with intelligent ads, and even getting their work into museums. A lot of the time, it’s hard to see how all the inspiration and excitement of graphic design for advertising can make it’s way into the information graphics social scientists use to communicate their findings.
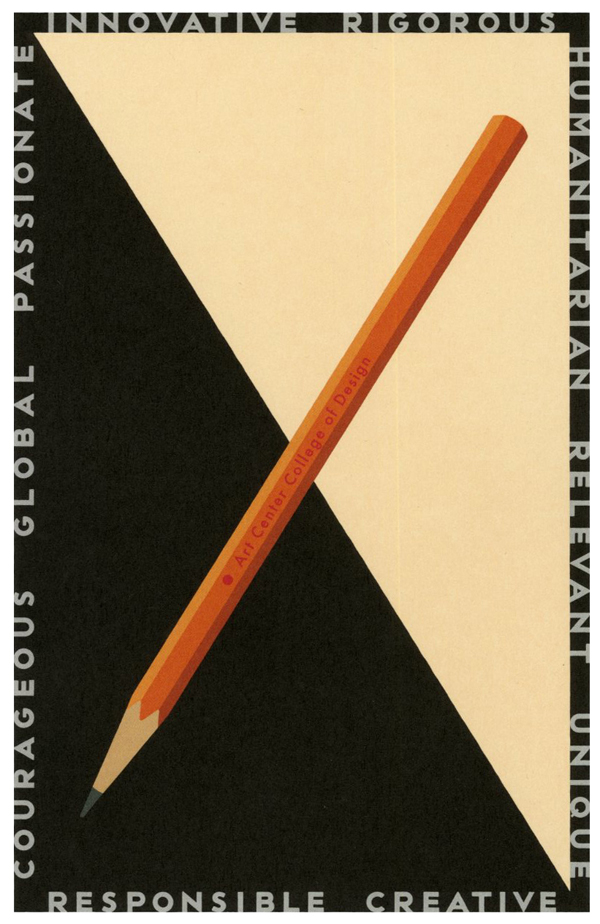
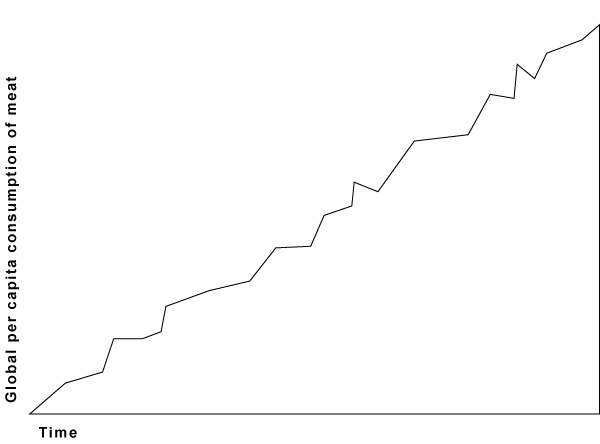
I took a fake example to show you how I translated my appreciation for Schwab’s design into some thoughts about enlivening a basic line graph. Let me emphasize this one more time: this example is fake. I didn’t use real data. Yes, global consumption of meat is increasing per capita, but no, it’s not as dramatic at it appears here. I went ahead and left off scales on the X and Y axes to ensure this graphic doesn’t end up traveling around the interwebs as truth.
Step 1
Break down Schwab’s graphic. He’s basically got a right triangle sitting on a single color background that bleeds into a thick border. The border contains the only text. The only realist element – the pencil – intersects the triangle to make what is like a giant X in the center of the poster.
How is this at all like social science graphics? Well, if you flip the triangle, it’s a lot like any positive relationship as depicted by a line graph.

What next?
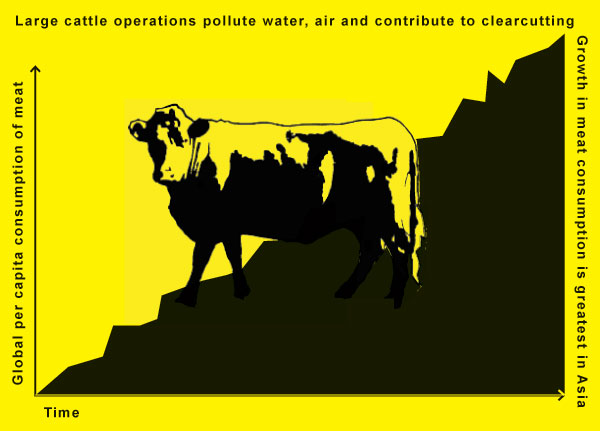
Now that you can see how a line graph is a little like Michael Schwab’s elegant pencil poster we can start to apply his decisions directly to our graphic. First, we can add a clearer background. If it’s just white the thick borders do not read as thick borders. They just look like the same old place everyone puts their axial labels. I distinguish this by adding a background color which will pull the borders into a relationship with the background behind the graph. I also go ahead and fill in the area under the graph to help nudge it into reading as an area, rather than some jiggly line.
The tough part here is the graphic. Not all stories we want to tell are going to be linked to a slender X-making image. I chose to depict the rise in meat consumption. Sure, I could have picked a cattle prod or other cattle killing tool dripping with blood. It would have been slender and I could have made an X. But I was trying not to appear unbiased so I just went with an iconic image of a beef cow. I planted the cow in the middle. We do lose a few data points in the middle – there are ways to deal with that if it’s important (overlay a yellow line across our cow’s gut where the data points are missing).
Here’s what we’ve got. The point is that the graphic below is the basically the same data as our line graph above except far more arresting (I took the liberty of adding two more lines of text – not necessary, but I was trying to closely follow Schwab’s concept). If you are trying to keep the attention of the audience in a presentation, be they sleepy students or sleepy colleagues, it might be worth your while to take a little extra time on your most important graphics. And if you do have one or two major points you want the people to take away from the graphic, you can write them across the top or up the side. Writing up the side is not as good – use it only for secondary points or graphic credits in the case that you hire someone to craft your graphics.

References
Schwab, Michael. (2009) “Instrument of Creativity” [poster design] Art Center College of Design in Pasadena, CA.
Hirasuna, Delphine. (2009) “Art Center’s Instrument of Creativity” in At Issue Journal: The Online Journal of Business and Design. San Francisco, CA.

Comments 3
Computer Internet and Technology Articles. » Blog Archive » Graphic Sociology » Translating inspiration into better design — November 11, 2009
[...] Here is the original: Graphic Sociology » Translating inspiration into better design [...]
Tweets that mention Graphic Sociology » Translating inspiration into better design -- Topsy.com — November 12, 2009
[...] This post was mentioned on Twitter by Hema Thadani, #design. #design said: #design Graphic Sociology » Translating inspiration into better design: How to go from inspiration to de.. http://bit.ly/4xwnTP [...]
Graphic Sociology » Illustration by Christopher Niemann – reflections on a pie chart — November 15, 2009
[...] pie chart before. Mostly, I just saw this and it made me smile. Recall from my earlier post Translating inspiration into better design that seeing something which you believe to be beautiful or clever can be a springboard for [...]