ACSBrochure320American families are diversifying in ways that are more complicated than ever, creating distinct patterns in different parts of the country and subgroups of the population. That’s why policy-makers and community leaders need detailed, locally-specific census data about family formation, marriage trends, divorce, and widowhood. This information is essential in order to accurately assess everything from population growth patterns to the special educational and social needs of different neighborhoods. Yet the Census Bureau has announced plans to cut from the American Community Survey several questions that provide such crucial information to researchers, planners, journalists, and the general public.

The questions to be cut include:

In the past 12 months did this person get—Married?

In the past 12 months did this person get—Widowed

In the past 12 months did this person get—Divorced?

Times Married—How many times has this person been married?

In what year did this person last get married?

What is the American Community Survey?

The American Community Survey (ACS) is the large Census Bureau survey that replaced the “long form” of the decennial census in the 2000s. It uses a sophisticated rotating geographic sampling design to gather information for households at all levels of geographic detail – even down to small neighborhoods. Administering the survey is expensive, but cutting these questions to save money in the short run will cost America dearly in the long run.

Why we need the ACS to keep these questions:

1. Believe it or not, there is no national count of marriages and divorces. In 1996, the government stopped collecting detailed national data on legal marriages and divorces. Now the government produces simple counts of marriages and divorces, but without any accompanying information about age of marriage, marriage duration, or number of remarriages. Furthermore, the figures they produce exclude six states (California, Georgia, Hawaii, Minnesota, Louisiana, and Indiana) that together account for 20 percent of divorces.

The ACS is the only reliable source of national, state, and city data on the frequency of marriage, divorce, widowhood, and remarriage. It provides data that is vital for estimating the impact of socioeconomic trends and social policies on marriage rates and on married and unmarried households.

2. The ACS is the only source of data that can measure marriage and divorce patterns in smaller sections of the population, such as particular states and cities, minority groups, and gay and lesbian couples. Asian Americans, for instance, are now a relatively small section of the population, but they are the fastest growing racial-ethnic group. Don’t we need to know what kind of family trends are occurring in this group?

Some things we can learn with the ACS data – and only with ACS data:

How divorce rates for “millennials” vary in the top 25 metropolitan areas: Surely it’s worth knowing that divorce rates range from 3.9 per 100 married people in Portland to just 1.4 in New York City. Other ACS data can help us understand what factors may account for this.

How divorce rates differ for 15 different Asian national-origin groups: Generalizations about “the” Asian population obscure the fact that Thais and Cambodians have much higher divorce rates than Indians and Pakistanis.

How the recession affected divorce rates: The recession appeared to have slowed some divorces in its initial years. This was followed by an uptick in divorces in 2012. But the 2013 divorce rate (just made available) shows a sharp drop in 2013. This drop has yet to be explained, which is why we need continuing detailed data from the ACS about the socioeconomic and cultural factors and local variations that may be involved.

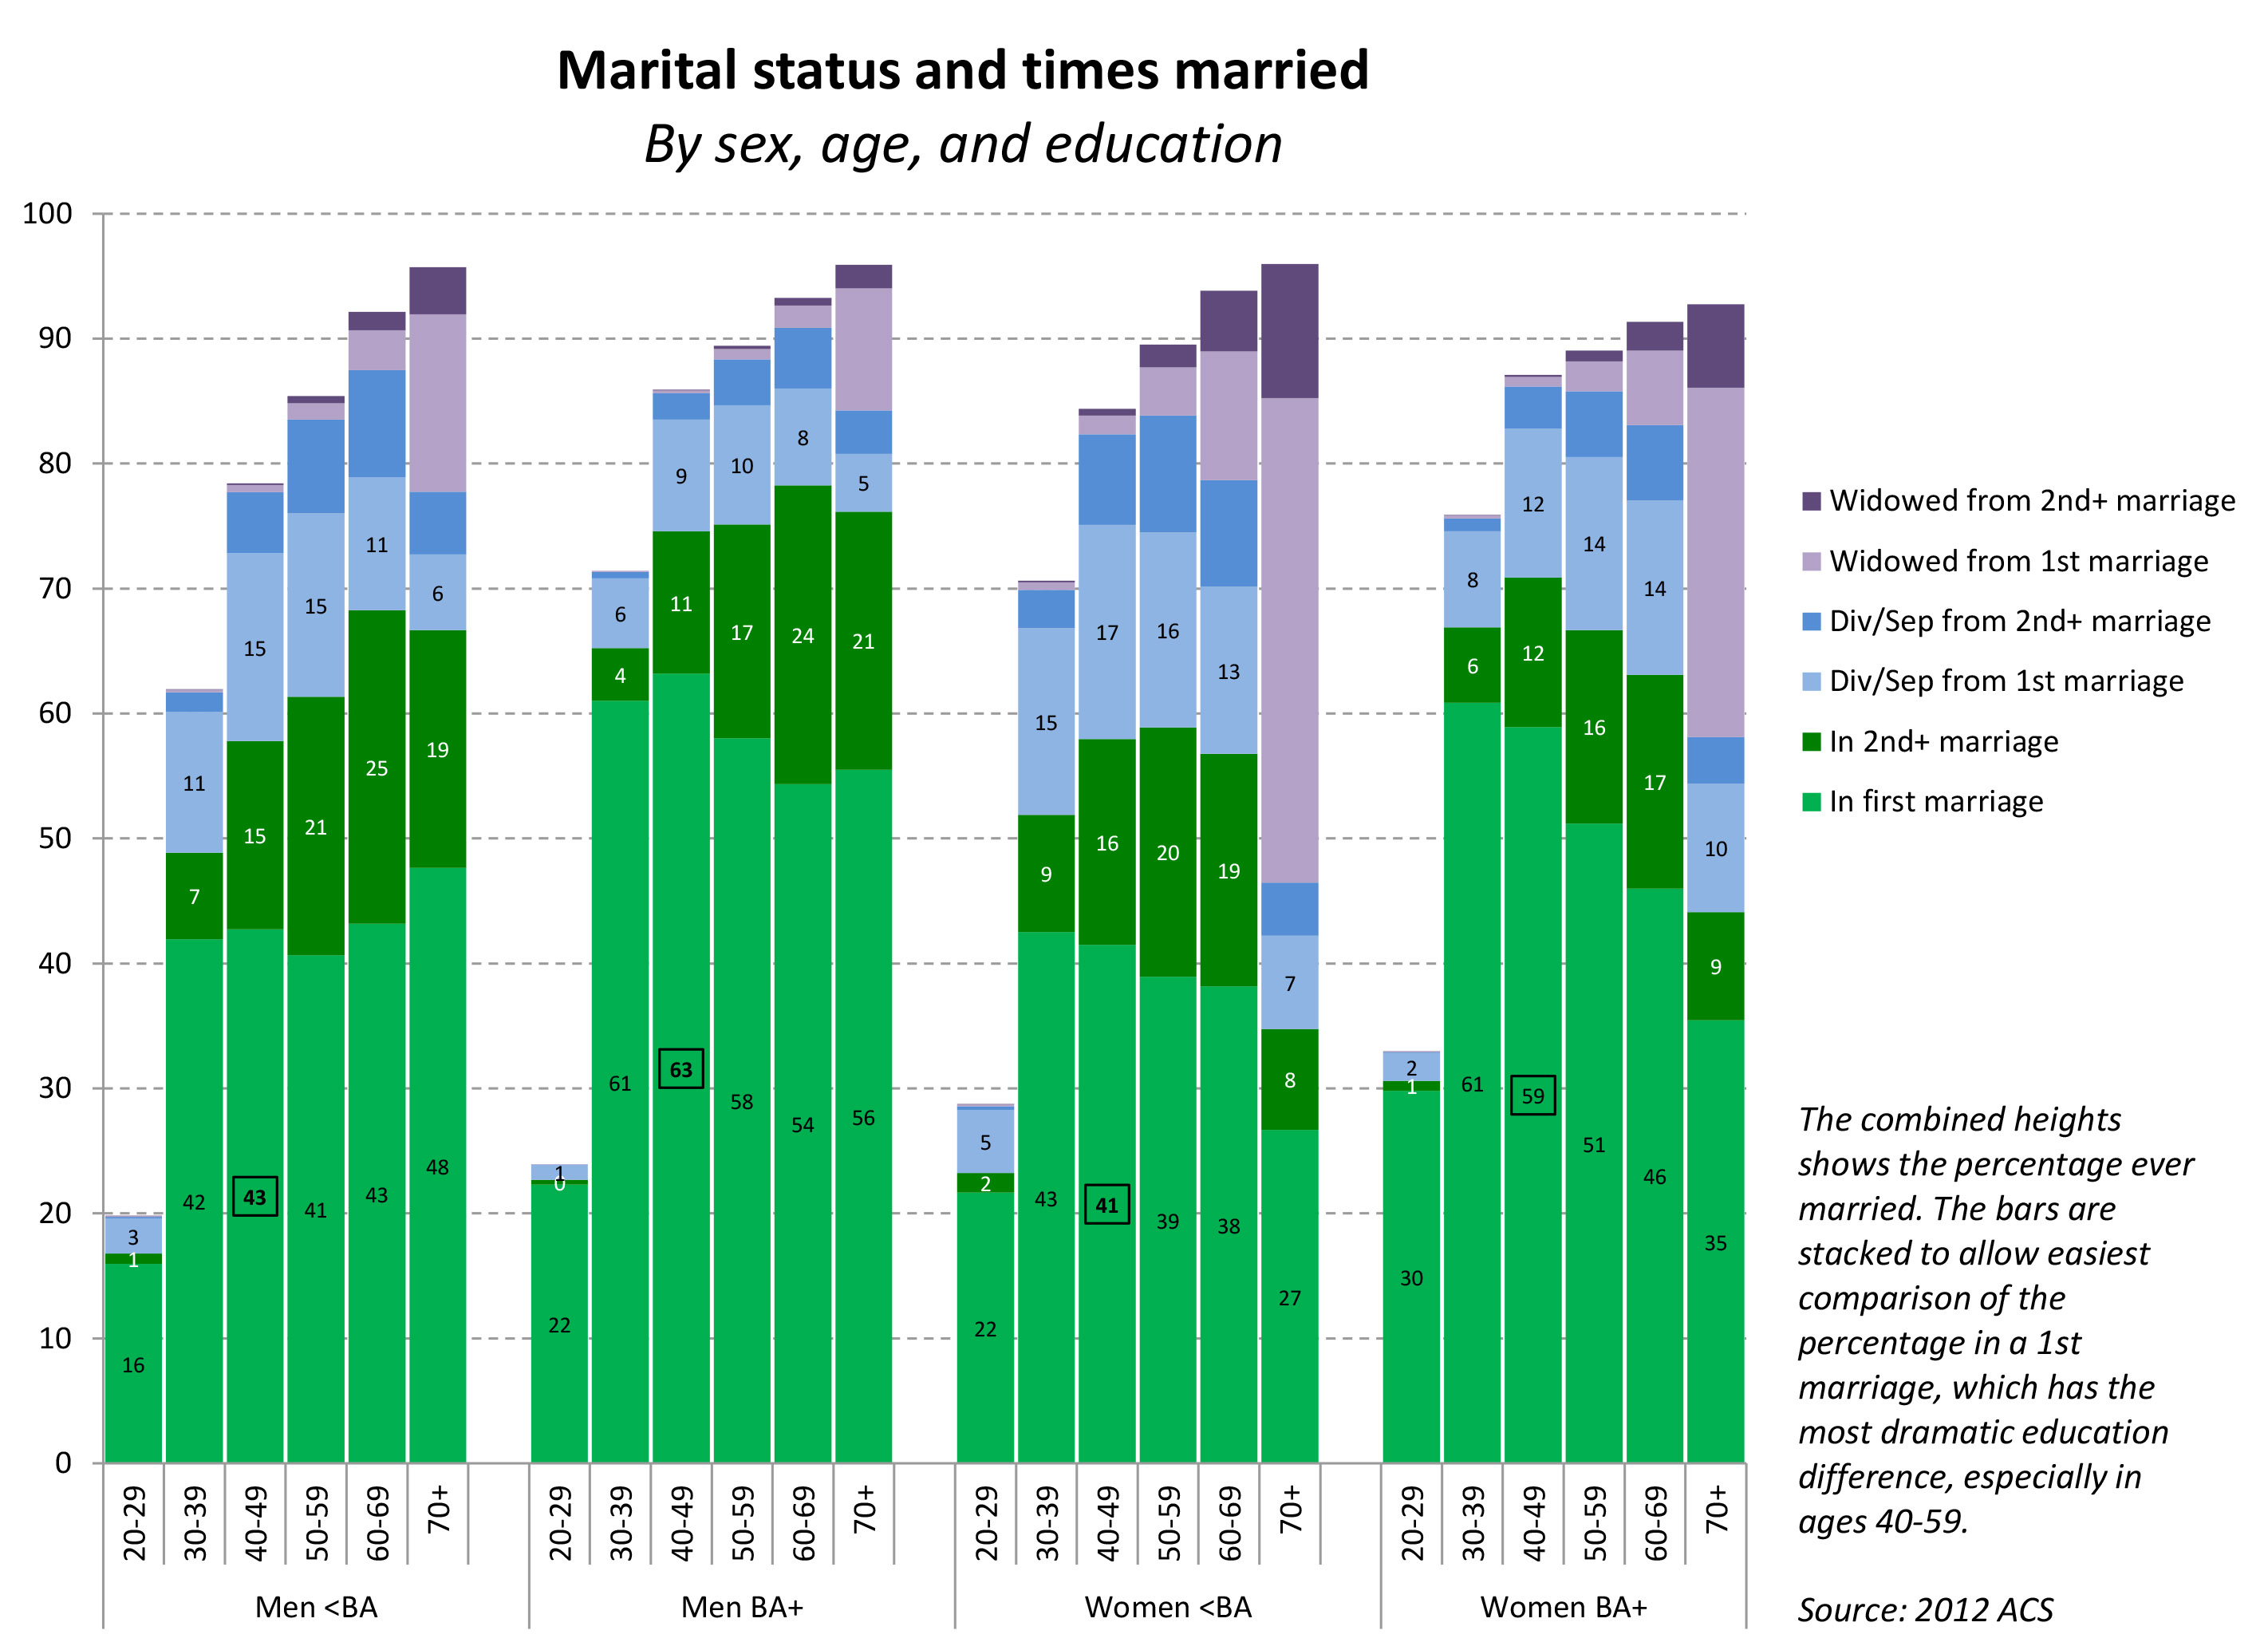
How marriage histories for men and women differ by education level: Married college graduates are much more likely than those with less education to be in their first marriages.

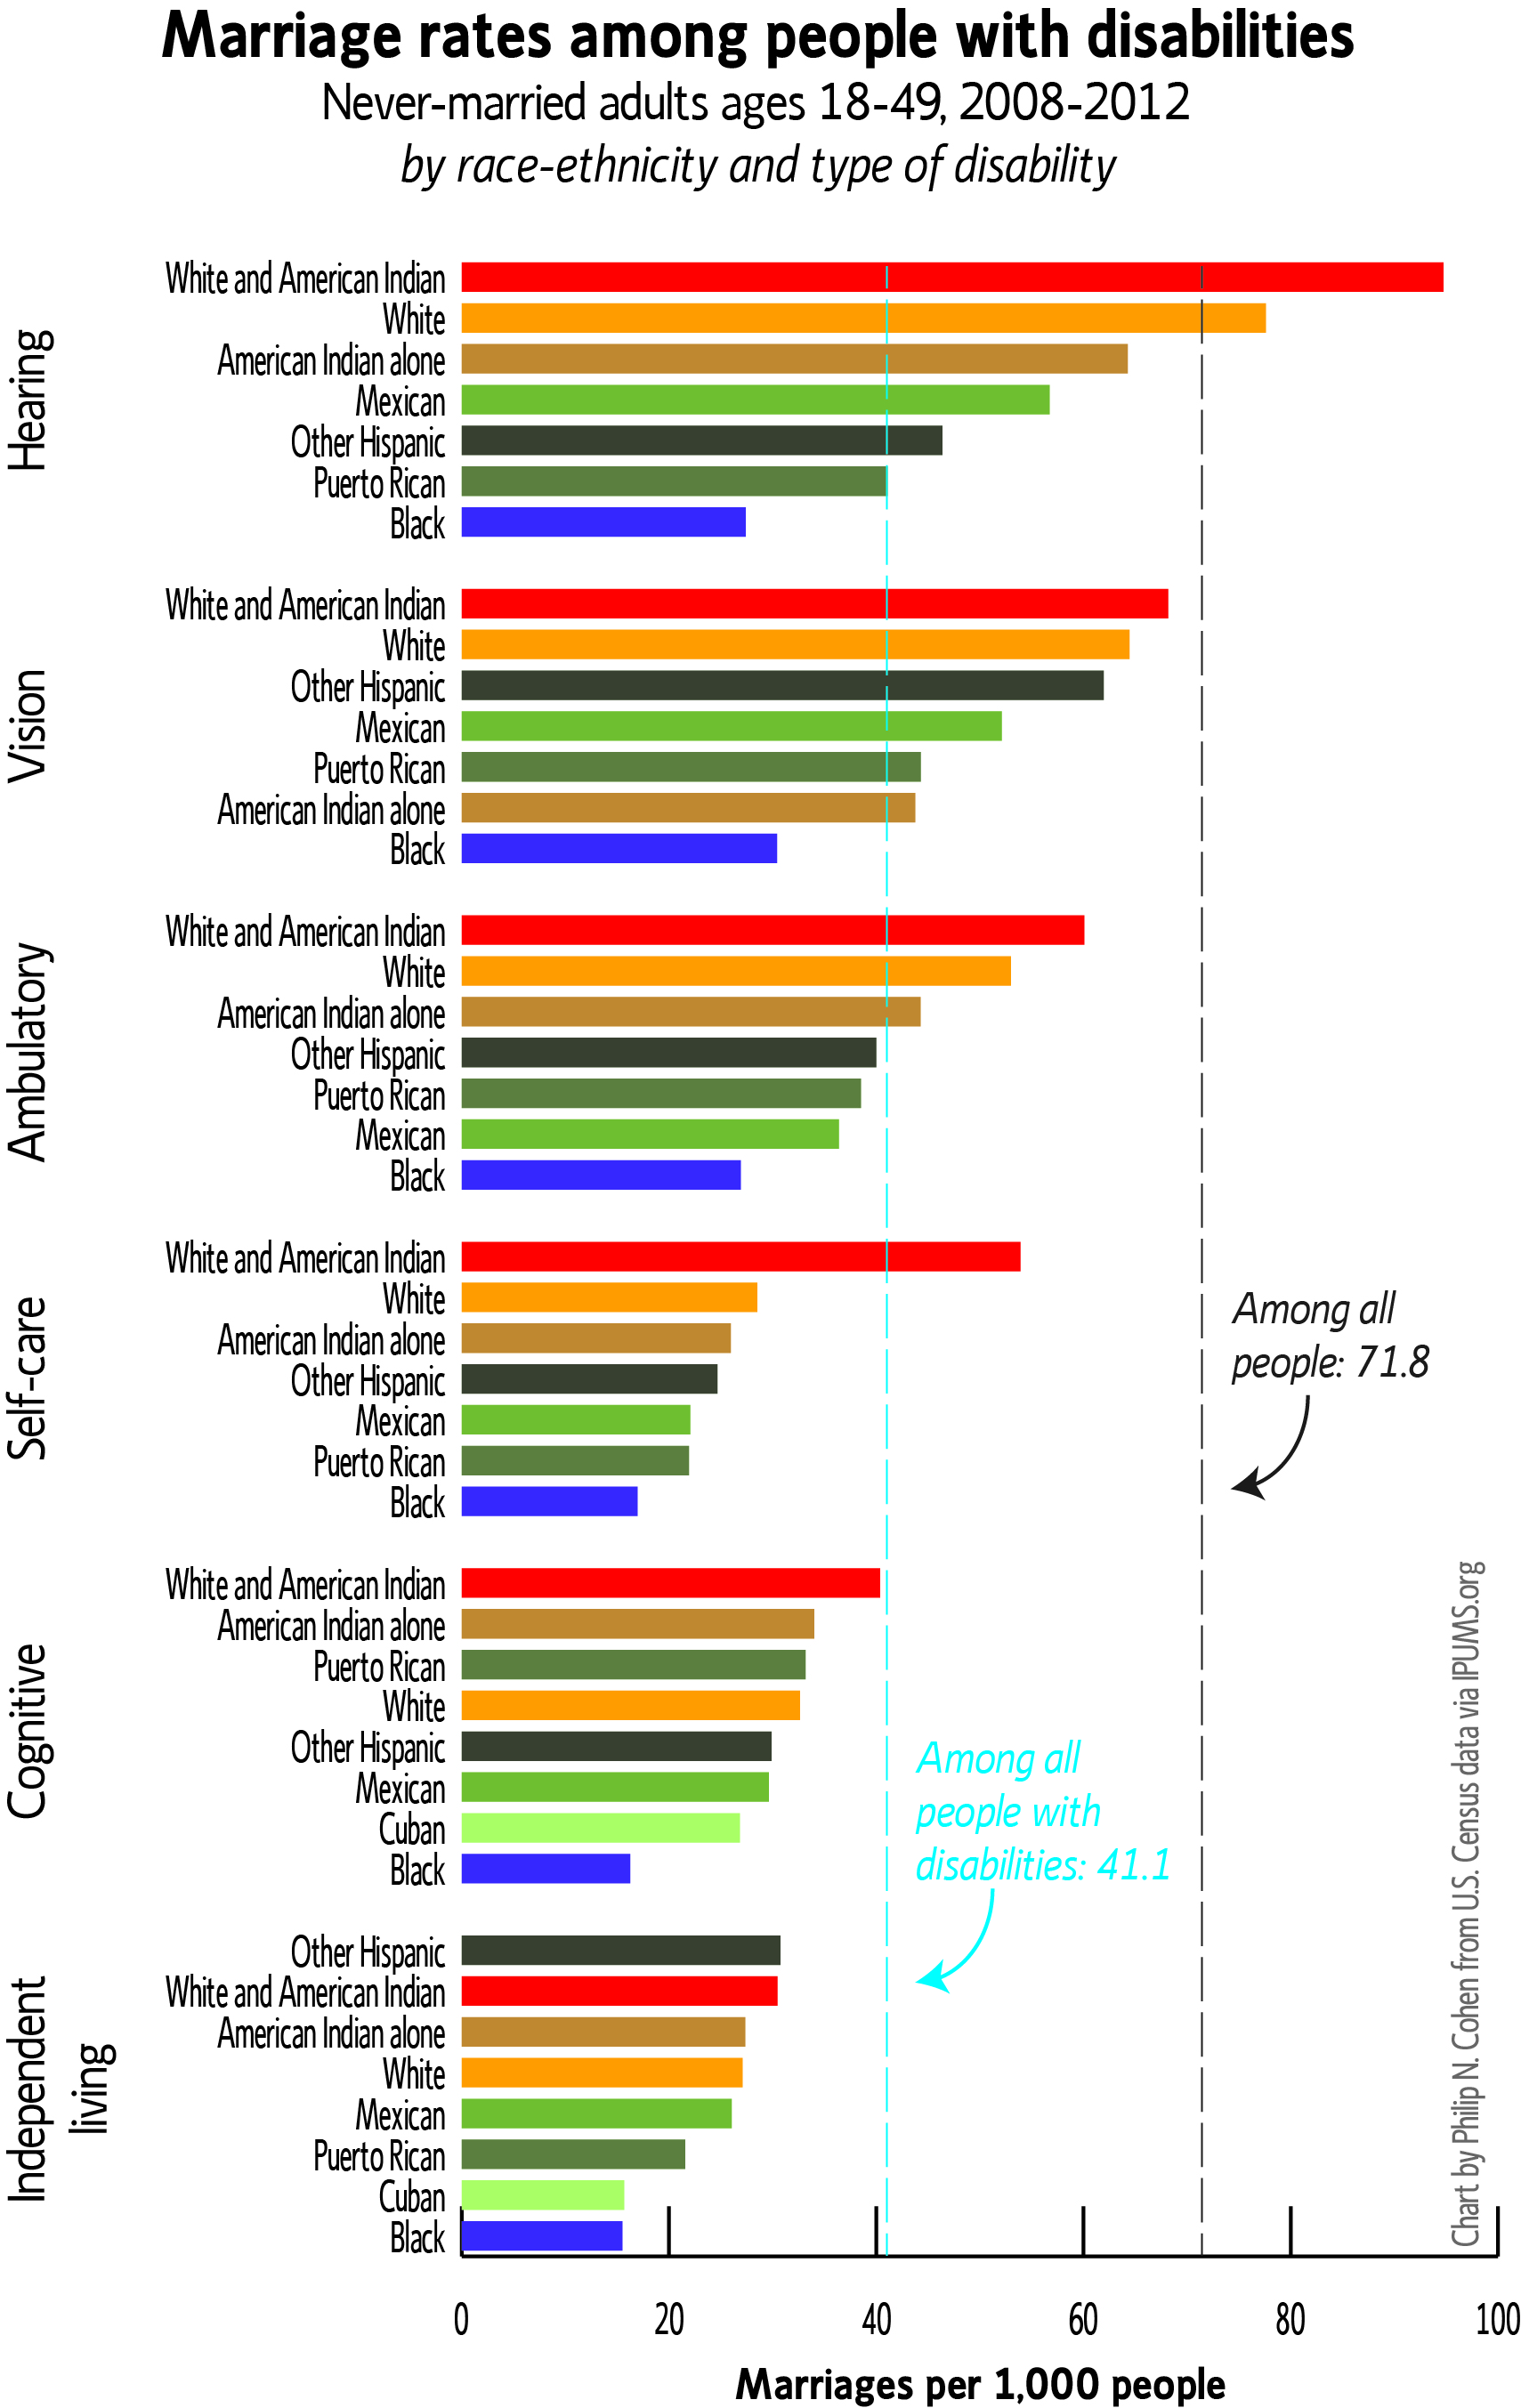
Marriage rates for people with different disabilities (by race/ethnicity): Having a disability reduces the chance that a person will marry. The overall first-marriage rate for people aged 18-49 is 71.8 per 1,000. For people with disabilities, it’s 41.1. But marriage rates vary by the type of disability, and also by race, regardless of disability type.

Detroit’s catastrophic demographic situation: Without the ACS we would not fully grasp the especially high divorce and early widowhood rates, falling population, educational failure, and unemployment that comprise the urban crisis there.

If we lose this kind of data, our ability to forecast future trends, anticipate potential problems, and understand our own families and local communities will be severely compromised. And that’s what might happen unless researchers and concerned citizens tell the government we need this kind of information to continue being collected. The government has given the public until the end of December to make its views known.

Information about the planned cuts to the American Community Survey is here: https://www.federalregister.gov/articles/2014/10/31/2014-25912/proposed-information-collection-comment-request-the-american-community-survey-content-review-results.

This briefing paper was prepared for the Council on Contemporary Families by Philip Cohen, Professor of Sociology, University of Maryland.


Cross posted on the Family Inequality blog.

Disability is a very broad concept, representing a wide array of conditions that are not easily captured in a simple demographic survey. However, disabilities are very prevalent, especially in an aging society, and the people who experience disabilities differ in important ways from those who do not. Previously I reported — in a preliminary way — that people with disabilities are much more likely to divorce than those without. Here I present some numbers on marriage rates.

This isn’t the kind of thorough, probing analysis this subject requires. But I have two reasons to do it now. First is that I hope to motivate other people to pursue this issue in greater depth. And second, I want to highlight the importance of the data I’m using — the American Community Survey (ACS) — because it might be not available for much longer. These questions have been slated for demolition by the U.S. Census Bureau on cost-saving grounds. I put details about this issue — and how to register your opinion with the federal government — at the end of the post.

Disabilities

The ACS asks five disability questions (I put the shorthand label after each):

  1. Is this person deaf or does he/she have serious difficulty hearing? (Hearing)
  2. Is this person blind or does he/she have serious difficulty seeing even when wearing glasses? (Vision)
  3. Because of a physical, mental, or emotional condition, does this person have serious difficulty concentrating, remembering, or making decisions? (Cognitive)
  4. Does this person have serious difficulty walking or climbing stairs? (Ambulatory)
  5. Does this person have difficulty dressing or bathing? (Independent living)

These aren’t perfect questions, but they cover a lot of ground, and the ACS — which involves about 3 million households — can’t get into too much detail.

One great thing about having these questions on the giant ACS is you can use the data to get all the way down to the local level, or into small race/ethnic groups. And with the marital events questions, you can combine disability information and marriage information.

First-marriage rates

Using marital events (did you get married in the last year), marital history (how many times have you been married), detailed race and ethnicity breakdowns, and the disability questions above, I produced the following figure. This uses the combined 2008-2012 ACS data because these are small groups, but even with five years of data these groups get quite small. There are about 90,000 non-Hispanic Whites with a cognitive disability in my sample, but only 356 people who are both White and American Indian with a hearing disability (the smallest group I included). This sample is people ages 18-49 who have never been married (or just got married).

disab-marriage-rates

The overall first-marriage rate for people ages 18-49 is 71.8 per 1,000. For people with disabilities it’s 41.1 (shown by the blue line). So that’s much lower than for the general population. But there is a very wide variation across these groups, from 15.5 per thousand for Blacks with disabilities in independent living all the way up to above the national average for Whites and White/American Indians with hearing disabilities. (For every condition, Blacks with disabilities have the lowest marriage rates.)

I don’t draw any conclusions here, except that this is an important subject and I hope more people will study it. Also, we need data like this.

In previous posts demonstrating the value of this data source, I wrote about:

Whether you are a researcher or some other member of the concerned public, I hope you will consider dropping the government a line about this before the end of the year.

The information about the planned cuts to the American Community Survey is here: https://www.federalregister.gov/articles/2014/10/31/2014-25912/proposed-information-collection-comment-request-the-american-community-survey-content-review-results:

Direct all written comments to Jennifer Jessup, Departmental Paperwork Clearance Officer, Department of Commerce, Room 6616, 14th and Constitution Avenue NW., Washington, DC 20230 (or via the Internet at jjessup@doc.gov).

Comments will be accepted until December 30.

By Georgiana Bostean and Leah Ruppanner

We face a care crisis in the United States—the older adult population is growing rapidly, yet systems to provide care for them are inadequate, relying largely on informal, unpaid care. The U.S. population ages 65 and over is projected to double in the next 25 years, creating unprecedented need for caregivers as the largest cohort ever, the baby boomers, enters old age. If you live in the United States and have aging parents, chances are good you will be tasked with caring for them in their later years, especially if you are a woman or member of a racial/ethnic minority group. Who steps in to be a caregiver, and the implications of caregiving, are important social, political, and ethical questions. How will we meet the care needs of older adults? And what are the costs of caregiving to the family members with aging relatives?

Taking care of aging relatives has its rewards and its challenges. It can provide a sense of meaning and improve social relationships. But it can also be stressful and have health-harming effects, impairing immune function and accelerating immune system aging. And it turns out that the benefits and harms to caregivers depend partly on the social context in which the caregiving takes place.

To help figure out how caregivers are affected in different social contexts, we studied 22 European countries to assess whether those in countries with greater societal pressure for informal family caregiving – in the form of strong social norms for familial care or limited public transfers for old age programs – have lower well-being than caregivers in countries with weaker familial care norms and more old age public transfers. We found that strong norms in favor of caregiving at home — and less government support for elder care — are associated with increased harms for female caregivers.

Sociologists often point out how macro-level forces (such as social norms) affect individual outcomes. Our recent research, just published in European Sociological Review, sought to understand how two features of different countries — social norms surrounding caregiving, and public funding for old age programs — are associated with individual caregivers’ well-being.

In the United States, how to provide care for aging family members is largely an individual decision, but social norms and public policies exert powerful influence on individuals’ ideals and ability to act on and carry out those ideals. Caregiving work has historically fallen to women and minorities, reflecting a system of “coerced care,” as Evelyn Nakano-Glenn calls it. Caregivers are not literally forced into their family roles. Rather, certain population groups experience social pressure through norms, and lack of institutional support.

Research suggests that when people are expected to do something based on their social status, but they do not have the resources to fulfill those expectations, they experience health-harming role strain. Caregiving, therefore, may be most deleterious to health when individuals are expectedto provide care, but lack the resources to do so effectively. In such contexts, when alternate options are unavailable, women particularly may step into caregiving roles and suffer health consequences as a result. Many studies find that caregiving affects women more than men; for example, caregiving daughters report greater depression while caregiving sons do not. Thus, coerced care can harm caregivers’ well-being, particularly for women.

In our study of 22 countries, we found substantial variation in people’s attitudes about whether care for aging parents should be provided by adult children in-home. Support for familial care ranged from 4% in Sweden and the Netherlands, to 59% in Poland, and 74% in Turkey.

familial care norms.xlsx

So, do country differences in familial care norms impact individual well-being?

Our results surprised us. We expected that caregivers in countries with strong familial care norms (i.e., where caregiving for aging parents is expected to be provided in their children’s home) would report worse well-being than those in countries with weaker familial care norms — because they were pressured into the caring role. We found, however, that only female caregivers’ well-being was worse in those countries. Female caregivers also have lower well-being in countries with fewer public transfers to support care for the aging. So, women in countries where there are strong social norms for familial in-home care – and where market or government subsidies for old age care are not readily available – may be more severely disadvantaged by caregiving responsibilities. This is consistent with research showing that female caregivers are more likely to be stressed, depressed, drop out of the labor force, and be sandwiched (caring for both a child and older adult).

That female caregivers in ostensibly coercive contexts report worse well-being may reflect role strain, related to lack of financial, socio-emotional, and other resources. Consider what it takes to provide care for an older adult, especially long-term. In the United States, taking time off from work to provide care for a family member is difficult, even a financial hardship for many. There is no federal paid family leave policy, and only about half of workers are eligible to take leave under the Family Medical Leave Act (meaning they may take up to 12 weeks off, mostly unpaid, without losing their job); thus, the economic implications of caregiving for a family member—be it a newborn, disabled person, or aging adult—can be disastrous for many families.

With over 65 million informal family caregivers in 31% of U.S. households, the current system is unsustainable. As the burden of care and the number of caregivers increase, so too will the social, economic, and health costs of caregiving. Middle-age adults who are beginning to experience their own health issues face compounding health effects of caregiving, leading to health risks earlier in life. This will inevitably strain the health care system as the number of caregivers grows.

What can we do to mitigate this bleak situation? First, we need a wide-ranging discussion about the vast challenges of informal caregiving in the current system, and how to promote equitable sharing of caregiving work in society. Second, we must address policy deficiencies, including the current piecemeal state-based approach that leaves many caregivers exposed. Potential starting points include broad policies to support caregivers through increased paid home care and community-care services. Recent innovative programs – like the one introduced for Pennsylvania, and federal respite care provisions – are first steps. Comprehensive federal policy changes that extend current family leave policies would also support caregivers, including paid and longer leave, and broader definitions of “family,” which would expand the range of people eligible and able to provide care.

Caregivers provide a valuable service to their loved ones and to society. Providing support for them is as pressing a social problem as providing care for the boomers heading toward old age. As older adults account for a larger share of the U.S. population, shifting demographics create unprecedented challenges for individuals and policy-makers alike. There is no better time to begin planning for this immediate future.

Cross-posted on Family Inequality.

Last year I posted a list of blog pieces by subject, to help people teaching family courses generate ideas and discussion. Now my book is done and some of that material is in there. If you use the book for your class, we’ll give you all kinds of awesome teaching materials. But if you’re not using it (yet), here’s another list of blog posts to supplement your course. I hope this is useful whether you’re assigning the book or not, and even if you’re teaching something besides a family course.

This is organized according to my table of contents. Please let me know what works and what doesn’t, and offer your additional suggestions in the comments.

1. Introduction

  • What current demographic facts do you need to know? These 22 demographic data points are a good place to start. What else is necessary knowledge just to get through the day without being grossly misled or misinformed?
  • High marks for Census: Describes the cultural shift at the Census Bureau that followed from Obama’s election and the decision to start counting gay and lesbian married couples. Also, a nice video they made explaining how a small error in a large population (mis-marking the sex box) can dramatically distort the number of a small population within it (same-sex couples).
  • Millennial, save thyself: Are millennials in trouble because their ties to marriage, work, and religion are weak? It’s “kids these days” all over again. With some simple data analysis and trends.

2. History

3. Race, ethnicity, and immigration

  • Black is not a color: Black and White are social, not biological, classifications. So why do we treat the words as if they were just colors?
  • Immigrant health paradox update: What can we learn from the surprisingly low infant morality rates of immigrants? Maybe healthier people migrate, but after a generation (or less) in the U.S., their advantage appears to erode.
  • The world that Sabta made: My grandmother lived from 1913 to 2009, and came to the U.S. from Poland in 1921, the youngest passenger on the S.S. Ryndam. Hers is one of the great stories of the century, leaving a mark that goes well beyond her 50+ great-grandchildren.

4. Social class

5. Gender

6. Sexuality

7. Love and romantic relationships

  • Is dating still dead? The death of dating is now 50 years old, and its been eulogized so many times that its feelings are starting to get hurt.
  • Online dating: efficiency, inequality, and anxiety: I’m skeptical about efficiency, and concerned about inequality, as more dating moves online. Some of the numbers I use in this post are already dated, but this could be good for a debate about dating rules and preferences.
  • Is the price of sex too damn low? To hear some researchers tell it in a recent YouTube video, women in general — and feminism in particular — have ruined not only sex, but society itself. The theory is wrong. Also, they’re insanely sexist.

8. Marriage and cohabitation

9. Families and children

10. Divorce, remarriage, and blended families

11. Work and families

12. Family violence and abuse

13. The future of the family

  • Tripping on tipping points: Minority births are now the majority. Is this a tipping point, a milestone, or a watershed? On the importance of accurately representing trends.
  • Dependency futures: An NPR story (linked here) on retirement prompts a look at how US demographic trends may be moving toward a future with more old-age dependency.
  • Marriage is declining globally: Can you say that? Yes, you can say that. But will it continue? We should be careful with predictions, but lots of demographic evidence suggests it will.

Stephanie Coontz has an excellent Op-Ed on the front of today’s New York Times Sunday Review, which draws out the implications for family instability of the connection between increasing gender equality on the one hand, and increasing economic inequality and insecurity on the other. The new instability is disproportionately concentrated among the population with less than a college degree.

To help with her research, I gave Stephanie the figure below, but it didn’t make the final cut. This shows the marriage history of men and women by education and age. She wrote:

According to the sociologist Philip N. Cohen, among 40-somethings with at least a bachelor’s degree, as of 2012, 63 percent of men and 59 percent of women were in their first marriage, compared to just 43 percent of men and 42 percent of women without a bachelor’s degree.

I highlighted those numbers in the figure. Also striking is the higher percentage of divorced people among those with less than a BA degree (and higher widowhood rates). Click to enlarge:

age marriage history

Cross-posted on the Family Inequality blog.

Joanna Pepin is a graduate student in sociology at the University of Maryland, College Park. Follow her on Twitter at @CoffeeBaseball.

Comedian Louis C.K. has a comedy bit about the bravery necessary for heterosexual dating. He points out, perceptively and with humor, that (traditionally) men have to summon the courage to ask out a potential partner while women are courageous for dating men at all.

How do women still go out with guys, when you consider that there is no greater threat to women than men? We’re the number one threat to women! Globally and historically, we’re the number one cause of injury and mayhem to women. You know what our [men’s] number one threat is? Heart disease.

Although women continue to date, love, and sometimes marry men, marriage has been in decline for decades.

The response to this demographic shift has been to invest billions of dollars in marriage promotion. Although the primary (flawed) justification given to emphasize marriage is to decrease poverty – especially for single mothers and their children – marriage promotion activists also have argued that “marriage dramatically reduces the risk that mothers will suffer from domestic abuse.” This ideological thinking was debunked as early as 2004, but was revived when Brad Wilcox and Robin Fretwell Wilson published a piece in the Washington Post claiming the solution to violence against women is marriage.

The pro-marriage activists rely on statistics that compare rates of violence between cohabiting and married couples.  What they ignore are selection effects. For instance, research from the longitudinal Fragile Families and Child Wellbeing Study illustrated mothers’ strategies to keep their children safe by leaving relationships they see as unhealthy, especially those involving physical abuse. Sociologists Catherine Kenney and Sara McLanahan show in their research analysis of data from the National Survey of Families and Households that selection out of cohabitation and into marriage – and selection out of marriage through divorce – creates an apples-and-oranges comparison between these two groups.

Another talking point for the marriage promoters is that married men have lower rates of criminal activity compared to non-married men. However, the research is still unclear on whether marriage per se decreases criminal activity, or if crime cessation is associated with stable family ties — cohabiting, married, or otherwise. Moreover, this line of research investigates generalized crime and not intimate partner violence (IPV) specifically. There is no reason to think IPV operates in the same way, given that DV is characteristically a uniquely individual dynamic of one person establishing power and control over another. It also ignores research on violence in later life, which shows that violence doesn’t decrease over the course of a relationship, but rather abusive tactics change. If the marker of a lifelong commitment is what decreases IPV, having children together should also be associated with lower rates of DV.  However, many survivors of IPV continue to experience abuse during their pregnancies (and after) and there is some evidence that the risk of violence increases during pregnancy.

To no one’s surprise, the federally funded marriage promotion programs have had no impact on relationship quality of participants, couples were no more likely to stay together or marry after participating, and they had no effect on the frequency or severity of IPV. Yet, we continue to spend scarce welfare dollars on marriage promotion at the expense of the very real economic resources survivors of domestic violence need.  For example, although a Family Violence Prevention option grants temporary waivers of public assistance requirements for survivors of domestic violence, women are rarely screened for domestic violence and few are able to obtain the mandated services even when they do report domestic violence to their case worker.

Contrary to the theory that marriage reduces IPV, one could theorize that marriage is actually more dangerous for women. Sociologist Philip Cohen showed that prevalence of IPV has been declining over the same time period as marriage rates have been falling. While the myth of widespread stranger danger is pervasive, according to a report from the U.S. Department of Justice, in two thirds of female homicides, women were killed by an intimate partner or family member (24% were killed by a spouse or ex-spouse; 21% were killed by a boyfriend or girlfriend). Marriage theoretically increases perpetrator access to victims, and social sanctions as well as legal ties make it more difficult to leave dangerous situations.

Indeed, evidence we do have demonstrates marriage is no safe haven for women. In some ways our societal obsession with the institution of marriage may be placing more women at risk. Data from the Washington State Coalition Against Domestic Violence Fatality Review Project reveal that 45% of the women killed in DV homicides committed by male perpetrators had been married. These couples were more likely to be living together, have children together, and be in the process of ending the relationship. Public health researcher Sara Shoener affirmed what I witnessed as an advocate working with survivors of abuse: cultural narratives of linking marriage with success, the stigma of single motherhood, and religious beliefs about divorce hinder survivors’ ability to access the vital resources they need to keep themselves and their children safe. Creating a no-win situation, mothers are condemned if they raise their children alone, blamed if they don’t leave an abusive relationship to protect their children, and criticized for deliberately obstructing relationships between children and fathers if they exit an abusive relationship.

Image by the Washington State Coalition Against Domestic Violence. Data from Domestic Violence Fatality Review Project.

The pro-marriage movement seems to be borrowing a concept from the National Rifle Association, that “the only way to stop a bad guy with a gun is with a good guy with a gun.” As the NRA asserts that the solution to gun violence is more gun violence, pro-marriage advocates assert the solution to men’s violence against women is for women to marry men. Increase both access and dependence. Raise the stakes. Make the relationship permanent. This solution is not only illogical and unsubstantiated, it’s dangerous.


CORRECTION: The original version of this post had a major error – the second trend was coded wrong, showing percent married instead of percent single! I’ve correct it, and apologize for the error.

Earlier this month there was a funny segment on Fox and Friends where they took seriously a fake social media campaign, supposedly led by feminists, to end Father’s Day. “More of this nasty feminist rhetoric,” and The Princeton Mom (Susan Patton). “They’re not just interested in ending Father’s Day, they’re interested in ending men.”

Then Tucker Carlson jumped in to ask, “Why is it good for women? I mean, there’s a reason there are more women living in poverty now than at any time in my lifetime, it’s because there are fewer married women. I mean, when you crush men, you hurt women.”

His comment is doubly twisted. First, it supposes that the historical rise of single mothers is the result of feminists crushing men (thanks, Hanna Rosin). The decline in marriage is related to the falling economic fortunes of men, especially relative to women, but I don’t think you can lay much of that at the feet of feminists.

Second, are there really more women in poverty now because of single motherhood? Yes and no. Here are three trends (all based on civilian non-institutionalized women ages 18+, from the Current Population Survey):

1. Poverty is rising among all women (but still hasn’t reached 1990s levels)

Although the proportion of children born to women who aren’t married has increased – doubling in the past three decades – that doesn’t tell the whole poverty story. Because women’s employment opportunities increased during that time (and fertility rates fell), women’s poverty rates are lower now than they were in the 1980s and 1990s peaks.

Zooming in on the period from the low poverty point in 2001, you can see that the recent increase in poverty has affected single and married women, and the proportional increase is actually twice as great for married women (more than a one-third increase).

womenspoverty.xlsx

2. The percentage of poor women who are not married has risen (corrected trend!)

Nevertheless, the percentage of poor women who are not married has risen. During the 2000s recession, the percentage of poor women who are married hit an all-time low of 30%. Over the last four decades, as marriage rates have fallen, women’s poverty has become more concentrated among unmarried women. Single women have much higher poverty rates than married women, and the vast majority of poor women are not married. However, in the last 15 years, as single motherhood has become more common, the percentage of poor women who are not married has been basically flat.

fatra-pov2

3. The percentage of poor people who are women is falling

Diane Pearce wrote, “The Feminization of Poverty: Women, Work, and Welfare” in 1978, as single motherhood was increasing and women’s wages relative to men’s appeared flat. As the proportion of poor adults that were women approached two-thirds, this shocking term caught on. However, since then — as women’s earnings increased and wages fell for many men — that proportion has fallen to 58%.

womenspoverty.xlsx

These facts are not the whole story of poverty in the U.S. But they should be enough to stop the politically convenient simplification repeated by the Tucker Carlsons of our time. The problem of poverty is not a problem of women’s failure to marry.

Cross-posted on Families As They Really Are