inequality

Image of young students working together in a classroom courtesy of Ludi via pixabay CC0.

The practice of placing students in classes below or above their ability level is called mismatching–and while it may sound bad, it is often done deliberately and can be beneficial. For example, “overmatching”–when students are placed in more advanced classes than their previous performances would ordinarily merit–can actually improve performanceat the college level, as overmatched college students tend to rise to the occasion and succeed. But, does mismatching occur earlier on, in the middle school years? And is overmatching always the most advantageous position?

Fitzpatrick and Mustillo use nested, state-wide standardized testing data in their recent study to answer these questions. Starting with end-of-year test scores from Grade 5, and comparing scores in Grades 6-8, the authors find substantial mismatching does occur in middle school, with some students being more than a full grade level above or below their classmates in ability level. The most consistent predictor of mismatch was a poverty indicator. Non-poor students tended to be overmatched and poor students tended to be undermatched. And the outcomes of these mismatches are consequential and revealing.

When students are undermatched in these middle school years, their learning is slowed, and in the end, they underperform in all subjects. This means poorer students, who tend to be placed in classes below their demonstrated past ability, consistently show diminished growth. And while middle schoolers tend to benefit from being overmatched in math, the authors find that overmatching is detrimental in language arts. 

These findings suggest that all middle school students perform best when sorted into the most advanced math class possible, an opportunity more likely to be given to non-poor students. Alternatively, students perform best in language arts only when appropriately matched, which seems to not happen for most students. These findings call into question school sorting practices which appear to disproportionately undermatch poorer students and overmatch non-poor students. While schools and parents may think undermatching or even overmatching is beneficial, intentional mismatching seems to be harmful for most middle schoolers despite their economic status.

1 out of every 3 children will have their families investigated by Child Protective Services (CPS) over the course of their childhood. Many of these children come from poor families and/or families of color. Investigations by CPS are often invasive. Investigators enter family homes and ask probing questions. But through these investigations, CPS is also able to assess and respond to the needs of families, oftentimes concluding that child abuse did not occur.

Drawing on observation of 37 CPS cases, including interviews with investigators, mothers, and ethnographic observation of two Connecticut CPS offices, Kelley Fong argues that it is a combination of care and coercion that brings CPS investigators into so many family homes. CPS investigators can often provide much-needed resources to families that are otherwise difficult to access, such as care for mental health, as long as families comply with CPS’ demands.

Workers at schools, doctors’ offices, and social service agencies realize that many families and children need assistance that they are unable to provide. In response, such workers file reports with CPS even when they do not believe that abuse is occurring, in hopes that CPS will offer families the kind of tangible support that they are unable to offer.

However, the intervention of CPS is also coercive and intrusive. While CPS can provide access to resources, this help is offered alongside the threat that the agency will separate children from their parents. The anxiety and fear sparked by an investigation can make parents wary of interacting with any institution that may refer families to CPS, including schools, doctors’ offices, or social service agencies.

In the United States, a weak social safety net means that families are left with few options for receiving support. A referral to Child Protective Services is one of the few options left for administrators who are aware of the challenges children and families face at home. However, CPS investigations also bring fear and worry to these families and may marginalize them from the institutions of social life, such as their children’s school. Strengthening social support programs outside of CPS would allow families to get needed help from concerned professionals without intruding into and threatening family life.

Graphic via kissclipart.com.

Wage inequality in the United States has been increasing for four decades, and there are documented wage gaps by education, race, and gender. But new research shows that as big as wage inequality is in the United States today, benefit inequality is worse. And these gaps especially affect low-income Americans. 

The United States is unusual in that retirement benefits, health care, and paid leave are tied to employment rather than provided by the federal government. Employer-based benefits such as pension plans and employer-based health care therefore are not simply “extras,” but instead are the core of how Americans access health and other well-being resources. 

Just as some jobs pay much higher wages than others, some jobs come with much more extensive benefit packages. To examine the pattern within these benefit packages, Tali Kristal, Yinon Cohen, and Edo Navot examined the Bureau of Labor Statistics’s Employer Costs for Employee Compensation microdata. These data include the hourly cost of benefits for a nationally representative sample of jobs. The jobs are linked to employers, allowing researchers to track employer practices over time in a variety of sectors.

Looking at the time period between 1982-2015, inequality in benefits grew more than twice as fast as inequality in wages. Benefit inequality is larger than wage inequality both between and within workplaces (meaning both when comparing line workers at two different companies and when comparing a janitor to a CEO). Benefit inequality is only slightly higher than wage inequality within workplaces — largely because both are so high and have grown so much since the 1980s. But between-workplace inequality was almost six times higher in total benefits than in wages, indicating that the measure of a good job is more about benefits than the weekly paycheck. 

Why has benefit inequality grown? The authors have two answers: the decline of unions and the increase in nonstandard employment practices. Fewer and weaker unions mean less employee pressure for employers to provide strong benefits. Unions are especially effective at advocating for more equality in benefits, so the loss of union power is felt more in benefits than in wages. In addition, changes to employment practices including classifying more workers as independent contractors, temporary, or part-time mean that fewer workers qualify for generous benefit packages. A key part of these authors’ analysis is that workplaces have more control over the setting of benefits than the setting of wages, making benefits an easier place to decrease total compensation. 

While wage inequality is mostly a story of the richest Americans separating themselves from the middle-class, benefit inequality is largely a story of low-income jobs getting worse. For instance, while large firms can more easily provide a good package of benefits to all of their workers, these firms have increasingly subcontracted janitorial, food service, and delivery work. 

Benefit inequality is increasingly visible and increasingly life-or-death. These statistics represent the lives of workers who lack paid leave and health care during a global pandemic, and this article is a crucial addition to our understanding of how inequality matters today. 

Pamela Herd, Jeremy Freese, Kamil Sicinski, Benjamin W. Domingue, Kathleen Mullan Harris, Caiping Wei, Robert M. Hauser, “Genes, Gender Inequality, and Educational Attainment,” American Sociological Review, 2019
A woman receives her college diploma. Photo via pxfuel.

Both nature and nurture have always influenced who goes furthest in school. Recent advancements in genetics have found a way to modestly predict educational success through genes, and sociologists are engaging with that work to explore what social factors affect the expression of those genes. Because women’s access to higher education has historically been limited by social and structural barriers, genetic predictors of educational success may have been muted. Over the past century, women’s college access has increased, but has this also equalized the role played by genetics in predicting who attains a higher education? Tracing gendered effects of genetics over time can expose effects of gender discrimination in education.

Pamela Herd and her research team including Jeremy Freese, Kamil Sicinski, Benjamin W. Domingue, Kathleen Mullan Harris, Caiping Wei, and Robert M. Hauser decided to find out. Using data from three longitudinal surveys, they examined the educational attainment of participants born during different generations, including the Silent Generation (born 1931-1941); War Babies (born 1942-1947), Early Baby Boomers (born 1948-1953), Mid Baby Boomers (born 1954-1959); and Generation X (born 1976-1983). Each respondent provided a saliva sample which was analyzed for genetic intelligence indicators, or alleles associated with higher educational attainment. Respondents were then assigned a polygenic score — a big summary measure that has been shown in other studies to modestly predict educational success. The researchers used these scores to compare how much genes predicted educational attainment for the men and women born throughout the 20th century, and how this changed over time.

They found that the role of genetics in shaping educational attainment is strongly patterned by gender. Among participants born in 1939-1940, they found that men’s polygenic score was more tightly linked to their schooling than women’s at every age. Genetic predispositions helped men graduate college, but even women with the same genetic predispositions were limited by societal factors. 

But in comparing the patterns of men and women born in different generations, they found that gender differences varied as social conditions changed. Among the older cohorts, men showed a stronger link than women. The researchers believe that this was because women’s participation in higher education was severely limited during the 1950s and 60s, and because many men who had the grades (and the genes) to go to college either opted to do so to avoid the draft or mandatory military service or took advantage of GI benefits afterward. During the 1950s, however, the pattern began to reverse. This was likely because women in the older cohorts entered middle age, they returned to school as their childrearing responsibilities lessened and educational opportunities became more widely available. At that point the relationship between genetic factors and attainment increased–that is, the women who were genetically predisposed to do well at school were more likely to return in later adulthood. Around that time, more young women also began taking advantage of increased opportunities for higher education.

Among the youngest respondents, born in 1982 and for whom educational opportunity has been the most equal, genetics is no stronger a predictor of postsecondary educational attainment for men than for women. 

Examining the interplay between genes and the environment can help us understand how gender inequalities in educational outcomes have changed over time. It also reveals that finishing college is not automatically the result of individual traits, but instead shaped by the social environment.

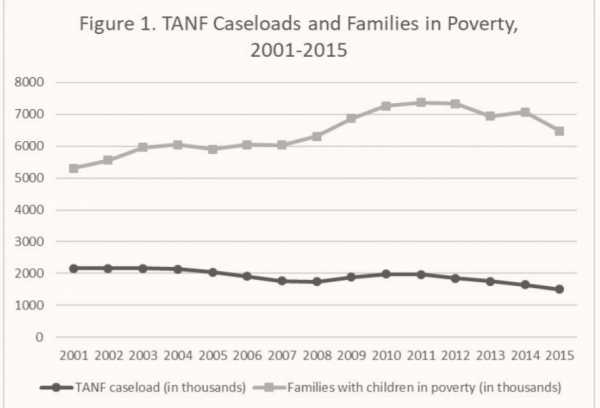
While the number of families in poverty has risen over the past two decades, the number of TANF recipients has declined.

As the United States enters a deep economic recession, more families will need to rely on the government for financial support. Many families have already received stimulus checks (though some are still waiting). But how much difference does cash assistance really make? According to a new study, direct assistance programs play a vital role in helping families with children avoid food and housing insecurity. 

H. Luke Shaefer, Kathryn Edin, Vincent Fusaro, and Pinghui Wu first examined state administrative data from 2001 to 2015 on the number of families relying on Temporary Assistance for Needy Families (TANF)– a short-term cash assistance program to support families with children struggling financially. They found that as eligibility rules were tightened, fewer households qualified for TANF and caseloads declined from 2.26 to 1.50 million. At the same time, families in poverty increased from 5.31 to 6.48 million.

Because the researchers were interested in how declines in cash assistance programs affect families’ well-being, they then looked at data on homelesseness and food insecurity. Data on the number of homeless public school children came from the National Center for Homeless Education, and data on food insecurity came from the Current Population Survey (CPS). Households were considered food insecure when they did not have access to an adequate amount and quality of food. For instance, families might not have had enough money to afford balanced meals or they might have cut the size of their meals to save money.

For all households with children, the decline in TANF caseloads led to increased food insecurity and student homelessness. The food security of single mothers with children were most affected by these declines. In addition, the relationship between cash assistance and homelessness was especially strong. This suggests that the decline in direct-assistance programs like TANF has increased the instability of children’s living situations. This is troubling because previous research shows that housing instability often leads to school instability and lower rates of graduation

This research shows how cash assistance programs play an important role in easing hardship for families struggling financially. As governments consider how to mitigate the effects of the coming recession, cash assistance is a proven way to help keep children housed and fed. 

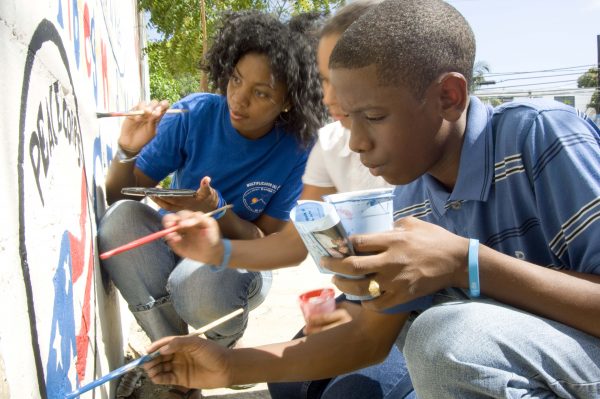
A Peace Corps Volunteer paints a mural on a main street with her students in the Dominican Republic. Photo by Peace Corps via Flickr.

Students graduating from college now are searching for jobs at the same time as 1 in 5 American adults have filed for unemployment in the past month. A growing number may have applied to service programs like the Peace Corps or Teach for America — 1-3 year programs that come with a small stipend or require fundraising and are dedicated to a specific mission. Scholars have hypothesized that these programs allow students to explore their identity during an extended transition to adulthood. But new research from Alanna Gillis finds that there are distinct class differences in why students choose service programs. 

Gillis interviewed 30 juniors and seniors at an elite public university who were considering service programs. She identified four different ways that students thought about their service opportunities. Some, for instance, saw service programs like Teach For America as pathways to employment, whereas others thought about service programs as a short-term, service-oriented experience before settling into a more stability-motivated long-term career. These ways of thinking corresponded with different social class backgrounds and orientations toward work values. But despite these differences, all of the students were using service programs to respond to constraints of the labor market.

Social class and financial situations were key to how students saw service programs. For instance, one set of students were intrinsically motivated to do a service program because of the identity and values that they had developed in college. They saw service programs as a step towards a service-oriented career that they couldn’t yet precisely define. These students came from more privileged backgrounds or had qualified for large enough scholarships that they had little student debt. In contrast, students who came from more marginalized backgrounds and had more immediate financial precarity were more likely to be “backup planners,” interested in applying for service programs largely to make sure they had some form of employment immediately after graduation, even though they would prefer a full-time job. 

Although these interviews took place in 2015-16, when economists saw the United States as mostly recovered from the 2008 recession, these students perceived difficulty in getting jobs. Whether service programs were a backup plan, an escape before taking a more constraining job, an explicit pathway into the labor market, or a short-term way to build human capital, service programs were a way to respond to challenges in the labor market. Given the horrific labor market during stay-at-home orders related to covid-19, it is likely that a lot of students are now backup planners. Considering that students in a good economy were looking to service programs to fill (and help jump) the gap between no job and a rewarding career, it is likely that service programs of all stripes will be more important than ever. 

Image: low camera angle photo of church pews facing the front of a sanctuary. Image courtesy of pixabay/marcino.

The Rev. Dr. Martin Luther King Jr. famously proclaimed that Sunday mornings contain the most segregated hour in America. MLK was talking about churches in 1960. Today, a small but growing reality is a move toward multiracial churches. These churches create a unique situation in which Black pastors have a seat at the table in predominantly white institutional settings. But, as recent research demonstrates, white pastors benefit more from leading a multiracial church. 

 Christopher Munn conducted a qualitative analysis using a national, stratified sample of 121 religious leaders to understand how race shapes inequality in multiracial churches. He looked at multiple social contexts (i.e. mentorship, leadership positions) and material resources (i.e. grant funding) that each leader described, weighing each social relationship by its potential benefit and perceived durability. Munn found clear racial differences in social capital, or the resources that come from social relationships.

First, white pastors hoard capital. They trap resources by sharing primarily with other white network members. This looks benign on the surface, as it commonly takes the shape of things like peer mentor programs, sharing social ties, and informal exchanges of resources in general. But access to these embedded resources is mostly limited to white men, and to a lesser extent white women. 

Second, Black pastors found a more symbolic seat at the table, in which their contributions were devalued and their access was restricted. For example, they could be paid a small sum for leading a diversity workshop for other church leaders, but were unlikely to find the more sustainable funds that white pastors were more able to access. 

In a telling example, a white male pastor serving on the board for a local healthcare system befriended the hospital’s CEO, and now his church’s nonprofit housing initiative receives $100K/year from that hospital. Racial inequality in wealth and access continues to matter, even in the leadership of religious organizations. 

Photo by Lori Newman, public domain

We know that children’s health depends on their parents in many ways, from genetics to life experiences. New research shows that the reverse is also true: children’s experiences impact their parents’ health. Specifically, this research shows that children’s experiences of discrimination influence their mothers’ health. 

Cynthia G. Colen, Qi Li, Corinne Reczek, and David R. Williams used data from the National Longitudinal Study of Youth, a survey following women and their children. They looked at mothers’ self-rated health assessments from the mid 2000s, when mothers were 40 and 50 years old, to determine how their health changed. The sample of mothers’ health assessments varied significantly by race. By age 50, only 17% of white mothers reported poor health, while 31% of Black and 26% of Hispanic mothers reported poor health. 

The researchers also looked at data on children’s experiences of unfair treatment when the children were young adults. Unfair treatment fell in two categories: major experiences or “acute discrimination,” and everyday or “chronic discrimination.” Acute discrimination included specific incidences like being unfairly fired or denied promotion and being unfairly searched or abused by police. Chronic discrimination highlighted the frequency of unfair treatment, like how often respondents had been treated with less respect than others, called names or harassed, or how often other people had treated respondents as if they were not smart. 

Overall, children’s exposure to discrimination — both acute and chronic —  was associated with significant declines in their mothers’ health at midlife (from age 40 to 50). This is an important finding because most research on intergenerational health focuses on how parents affect their children’s health. Studies like these can help us to understand how disadvantage is reproduced through generations.

The researchers wondered whether Black and Hispanic mothers’ poor health was a result of their children experiencing more discrimination than children of white mothers. They found this to be true for Black mothers, but not for Hispanic mothers. Specifically, children’s experiences of discrimination explained about 10% of the Black-white health gap, but very little of the Hispanic-white health gap for mothers.

In addition, Black mothers’ health declined at a slower rate compared to white mothers’ health, even when their children experienced high levels of discrimination. One explanation for this finding is that Black mothers spend a lifetime preparing to and dealing with discrimination, whereas white mothers may not and thus have fewer coping skills to deal with feelings of helplessness when their children experience discrimination.

This research helps us to understand how discrimination is more than just an individual experience. Stressors, like unfair treatment, can have “spillover effects” — in this case, leading to declines in the health of family members.

Photo of traffic jam, by ianholton,Flickr CC

We know that underrepresentation in media contributes to ideas that women are less competent and less likely to be experts. But can overrepresentation also perpetuate gender stereotypes? And do gender stereotypes spread differently through social media than traditional media? In a recent study, Muyang Li and Zhifan Luo analyzed social media and newspaper reports of traffic accidents in China to examine whether media overrepresentation drives the idea that women are worse drivers than men. 

The study collected 97,120 posts from Weibo, China’s largest social media site, and 11,290 newspaper articles from January 2010 to November 2018. Using computer-assisted text analysis, the authors identified articles’ topics and gender mentions. 

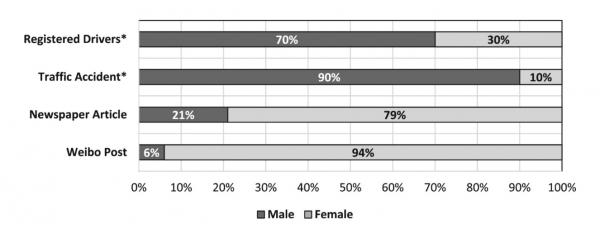
Graph showing the gender ratio of registered drivers, traffic accident, and media coverage.
Gender ratio of registered drivers, traffic accident, and media coverage (Li and Luo 2020).

Although women are underrepresented in actual traffic accidents — they are 30% of registered drivers in China and the drivers in only 10% of traffic accidents — both newspaper and social media posts were more likely to identify a driver as female. Seventy-nine percent of newspaper articles that mentioned a driver’s gender identified female drivers, while 94% of Weibo posts did the same. 

Gender stereotypes were overall less explicit in newspaper articles. Although newspapers were more likely to include the gender of the driver if they were female, the newspapers rarely blamed specific accidents on inherent bad driving. Weibo posts, on the other hand, often included direct discussions of the stereotype that women are worse drivers. Weibo posts mentioning female drivers were also more likely to be reposted than those mentioning male drivers, and police department Weibo accounts were the most likely to mention female drivers. 

The researchers dug deeper on a selection of Weibo posts that discussed sexism. Through a qualitative analysis they found that these Weibo posts included a mix of sexist and feminist arguments. Some of these posts argued that women were worse drivers or reiterated gender stereotypes about female drivers, but a substantial number used Weibo to call out sexism and argue that women are no worse at driving than men. In some ways, social media is still a toxic cesspool, but it’s also a place where people can talk back.

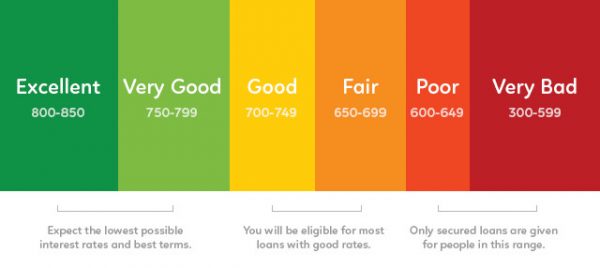
Picture of a color-coded credit score scale
Photo by CafeCredit.com, Flickr CC

It seems that algorithms are shaping more and more of our world. However, algorithms — rule or process-based calculations most often done by computers — have been an important part of society for centuries. In her new research, Barbara Kiviat explores how policymakers respond to one not-so-new use of algorithms and the predictions they can produce: how insurance companies use credit scores to set prices.  

Kiviat examines thousands of pages of documents and 28 hours of testimony from state, congressional, and professional debates and investigations around insurance companies’ use of credit scores. Credit scores are the output of algorithms that rely on huge amounts of consumer financial information. Insurance companies use these scores to set prices based on predictions of how often a customer will make insurance claims, so customers with lower credit scores have higher prices. In the insurance industry there is widespread agreement that this practice is justified because of “actuarial fairness.” In other words, the data is fair to use to set prices because credit scores do actually predict how often someone will use their insurance.

However, policymakers do not agree with the insurance industry’s argument of credit scores as “actuarially fair.” Instead, policymakers draw on ideas of “moral deservingness.” They try to understand whether or not people were responsible for bad or good behaviors that corresponded to their current credit score and insurance cost. Policymakers objected to the use of credit scores when they did not reflect policymakers’ understandings of what counted as good or bad behavior. For instance, policymakers sought to include sections for “extraordinary life circumstances” in insurance regulation that would not penalize consumers for poor credit scores resulting from, for example, the death of a spouse or child.

This research shows that policymakers do not object to predictive practices because they are mysterious or confusing. Rather, they object when algorithmic results disagree with existing assumptions of what is good or bad behavior. Kiviat’s findings are important to consider as algorithms and the predictions they create are used in more of our social and economic life, such as for identifying students at “high-risk” of poor academic outcomes, informing policing by “predicting” crime, or showing job ads to some individuals and not others.

Resistance to algorithms based on fairness can only go so far. Who will be protected from the use of algorithms if we think they are unfair only for “good” people?