
Updated June 19, 2020, with data from 2015-2019
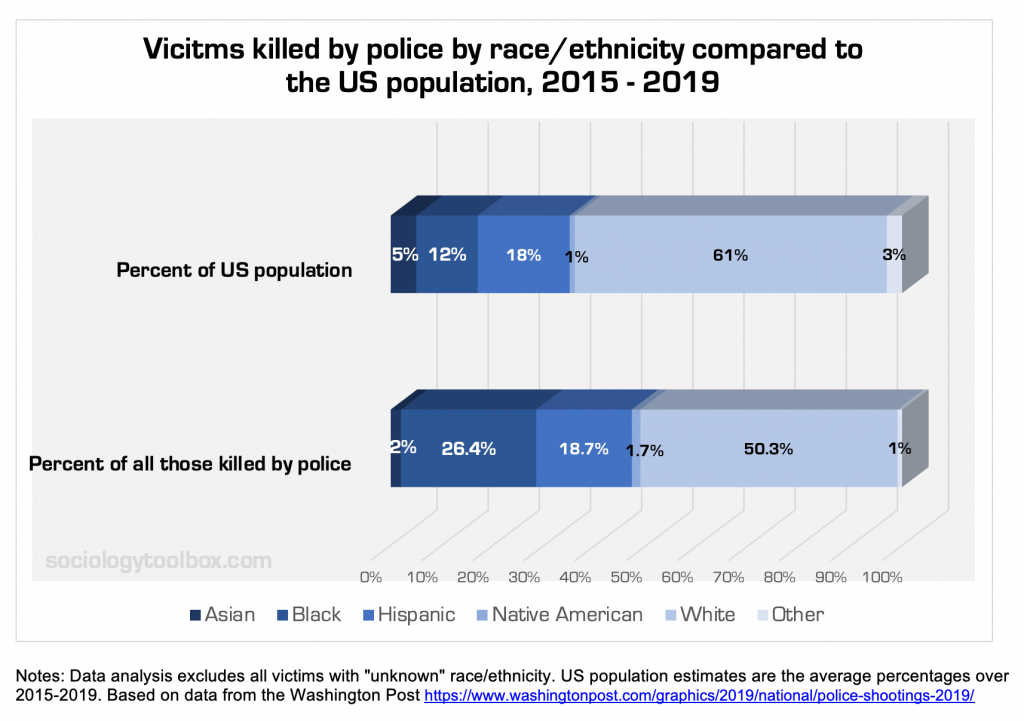
Data collected by the Washington Post on the use of lethal force by police officers since 2015 indicate that, relative to the proportion of the population, Blacks are over-represented among all those killed by police. As is evident in the figure below, (looking at the top blue bar) according to the US Census estimates, Blacks made up 12% of the population. However, from 2015 – 2019 they accounted for 26.4% of those that were killed by police under all circumstances. In other words, Blacks were the victims of the lethal use of force by police at nearly twice their rate in the general population. Whites make up the majority of victims of police use of lethal force (50.3%) from 2015 – 2019, BUT they also currently make up the majority of the population (61%). Asians make up about 5% of the US population but just 2% of the victims of the lethal use of force by police. Hispanics make up 18% of the US population and just over 18% of the victims of the use of lethal force by police. Native Americans make up 1% of the US population and 1.7% of the victims of the use of lethal force by police.
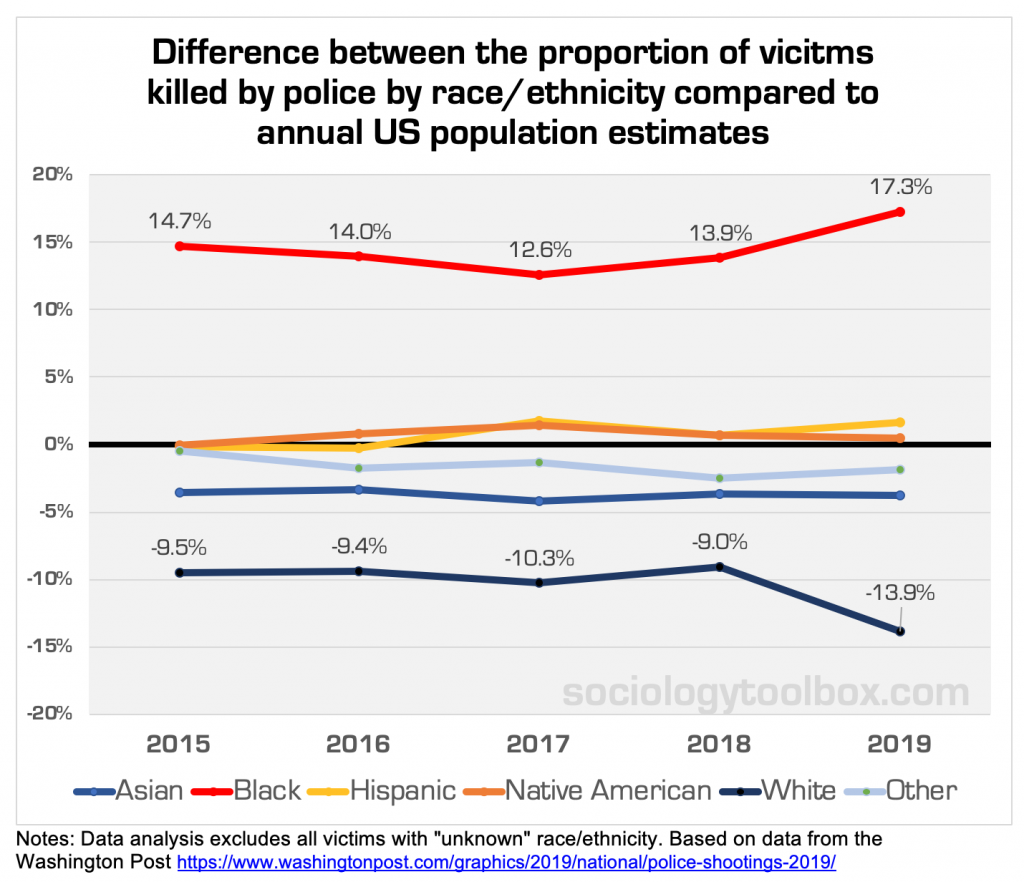
One way to think about it is over- or under-representation. All things equal, a socially-constructed racial group should be subject to lethal encounters with the police at a similar rate to their proportion in the population. The figure below shows the over- or under-representation of racial-ethnic groups from 2015 to 2019 comparing the proportion of victims of lethal police encounters to the proportion in the respective annual US population estimates. Data points that are above the 0% line indicate over-representation among victims of police lethal force and data points below 0% indicate under-representation. Since 2015, the earliest year of data collection from this particular source, blacks have been over-represented by around 15%, Hispanics, Native Americans, and Asians have been roughly similarly represented relative to their proportion in the US population, and whites have been under-represented by around 10%. (Note: At the time of writing, data from 2019 had a larger number of “unknown” racial/ethnic identities of victims, 20% compared to 3-10% in previous years.) The rate of over-representation for blacks is relatively stable from 2015-2018 and shows initial signs of an increasing trend in 2019.
Is that the right comparison? Shouldn’t we compare the percent of those killed by police to the percent of interactions with the police? Even more precise, shouldn’t we compare the percent of those killed by police to those encounters that were actually life-threatening to either the police officers or other people? There are several problems with such comparisons.
First, that data doesn’t exist. There are no national records of the nature of every encounter with police officers. Additionally, the definition of life-threatening encounters is subject to interpretation and video footage by bystanders or CCTV of many instances of the police use of lethal force has shown that what gets defined by officers as dangerous or life-threatening… is not. “Dangerous” is a subjective perception, even for police officers. Perceptions of danger are often tinted if not heavily skewed by explicit or implicit racist views that the black body is more dangerous. For more on the long history of race and policing see the book, Policing Black Bodies by Earl Smith and Angela Hattery, and From #BlackLivesMatter to Black Liberation by Keeanga-Yamahtta Taylor among many others. See here for scholars responding to the idea that blacks commit more crimes. See here for ideas on improving the research and need for more data. Policing does not occur in an objective social vacuum. The history of policing shows that it has been used to repress and control African American communities and other communities of color (see here and the books mentioned above).
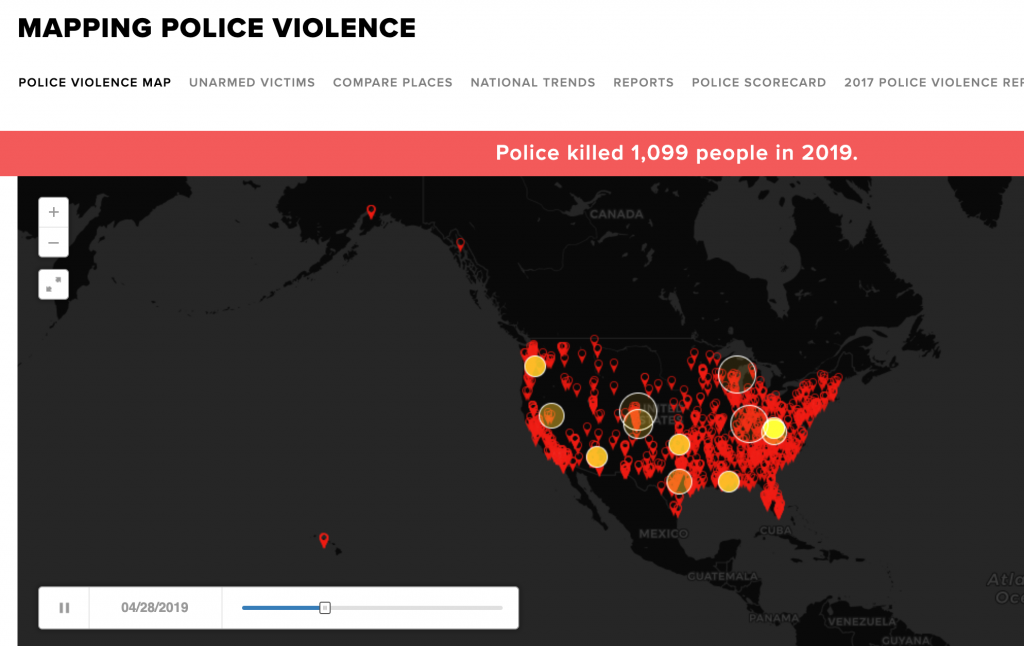
Second, the assumption that police encounters and the occurrence of crime are highly correlated is problematic. Crime statistics are records of policing, not crimes. Records of reported crime are records of victims who contact the police. We cannot assume that existing data on crime is a full account of crime or criminal activity. For decades there was a deliberate effort guided by formal policies that placed a focus of policing on drugs, the so-called War on Drugs. These policies and policing disproportionally targeted people of color resulting in mass incarceration even though whites and blacks report similar rates of drug use (see here and here). Racial profiling has been documented in traffic stops (a.k.a. “driving while black”, stop and frisk enforcement in New York City, and more. Whites conduct disproportionate surveillance of blacks (see here and here). From Mapping Police Violence:
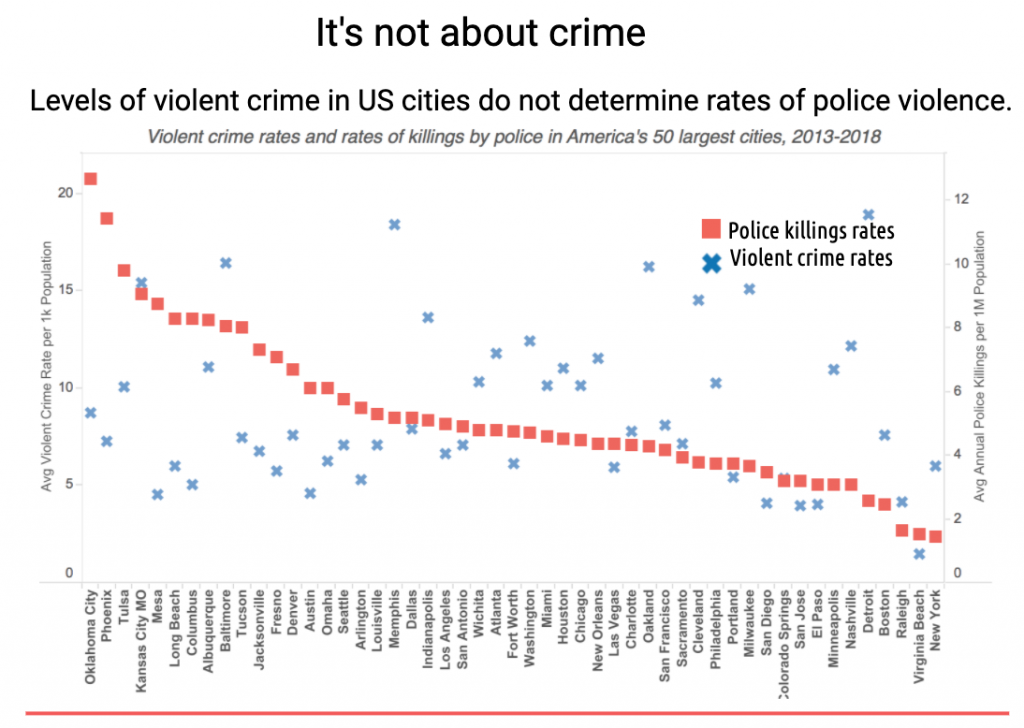
Policing happens in a social context. It is not objective. By comparing the proportions of racial-ethnic groups in the general population to the proportion of those killed by police, we take into account, without measuring directly, all the other social contexts that result in a disproportionate number of black victims of police lethal force. The social contexts of neighborhood segregation, income and wealth inequality, school resource inequality, school-to-prison pipeline processes, white supremacy, “color-blind” racism policy apathy, disproportionate poverty, voter suppression, labor force discrimination, and more.
Here is a specific example of how the level of policing does not correlate to the level of crime but rather the rate of the black population. In 2019, Lance Hannon and Aaron Siegel examined the police service areas of Philadelphia. In those areas where blacks make up less than 50% of the population, the correlation between police frisking people during traffic stops and the violent crime rate of the area is positive. Meaning that police are more attuned to the high rate of violent crime in some areas and are subsequently more likely to frisk people. We can see how that logic is reasonable for officers to engage. See that relationship illustrated below in the figure from their article in the sociology journal Contexts.
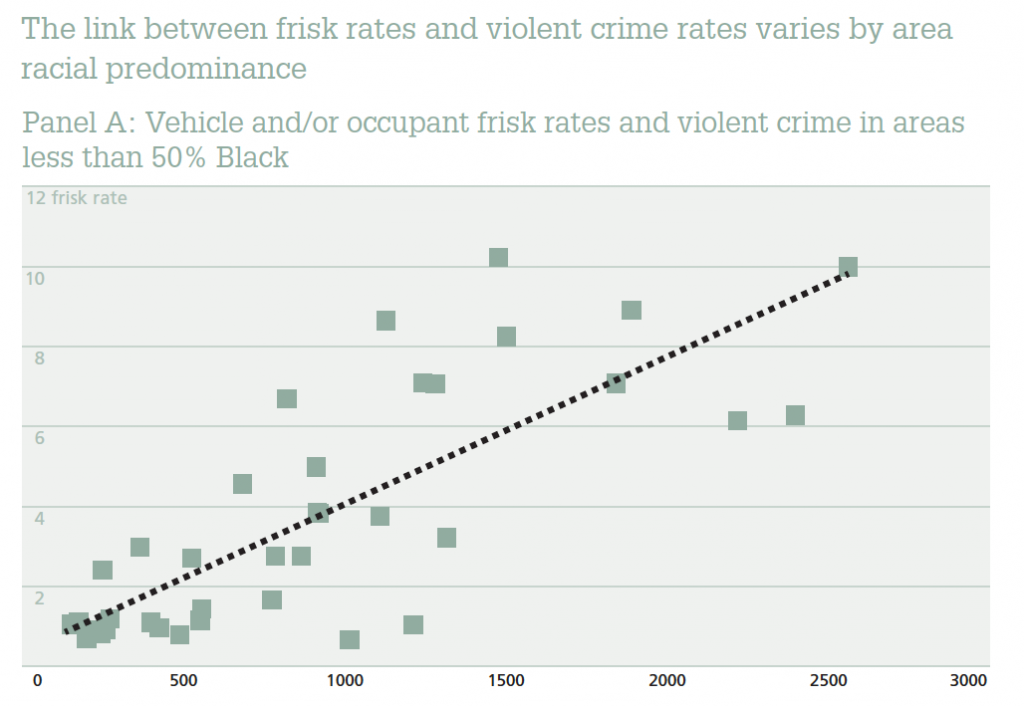
However, in police service areas of Philadelphia that are more than 50% black, the relationship between frisking and the rate of violent crime disappears. Traffic stops in these areas result in police frisking the drivers no matter the rate of violent crime. This relationship is evident in the figure below.
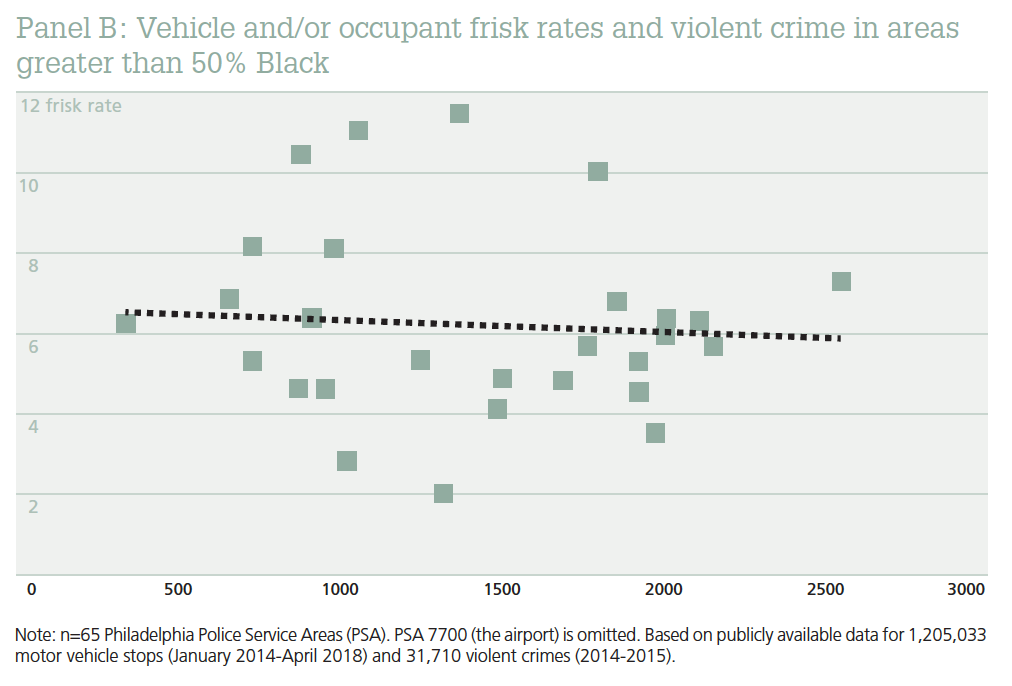
As the authors state, “One potential explanation for these trends is that police officers may not perceive differences in levels of dangerousness among Black neighborhoods in Philadelphia. As is evident in our graphic, majority Black areas tend to have higher average violent crime rates than other spaces. Yet it is also true that many predominately Black places have violent crime rates significantly below the city’s average. Consider the case on the far left in Panel B. It has a violent crime rate that is only one third of the city’s average, but a frisk rate that is three times that of the comparable low-crime places in Panel A (places that are not predominately Black). It is possible that low-crime Black areas end up being painted with the same brush as high-crime Black areas due to neighborhood-level racial stereotypes.”
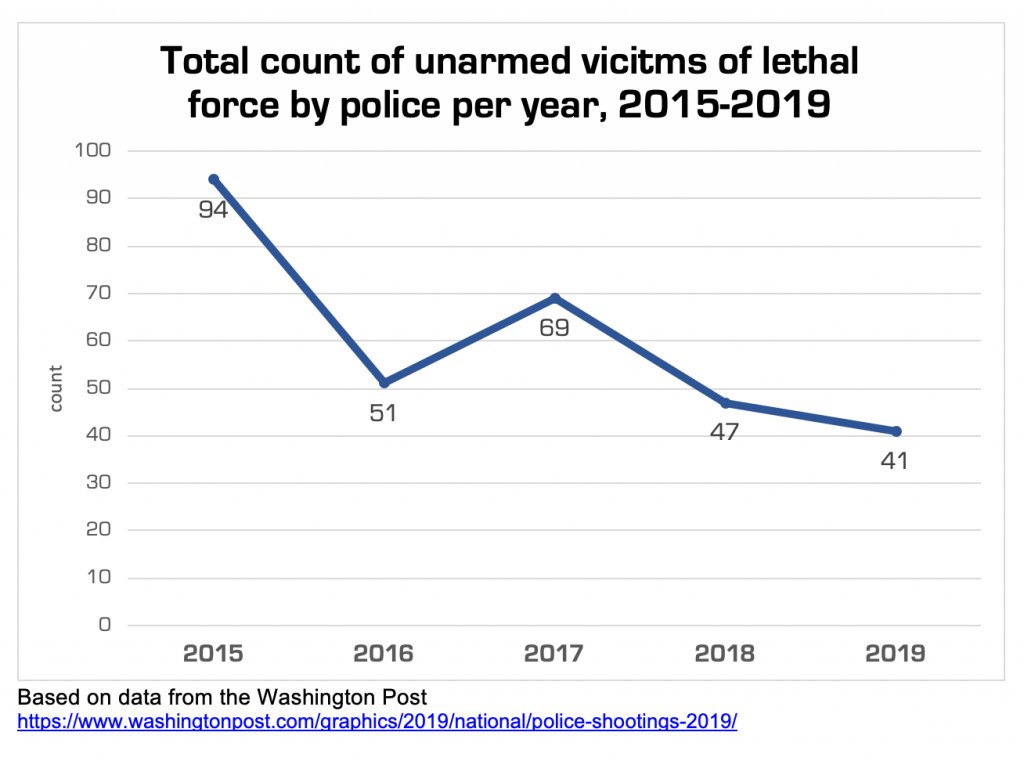
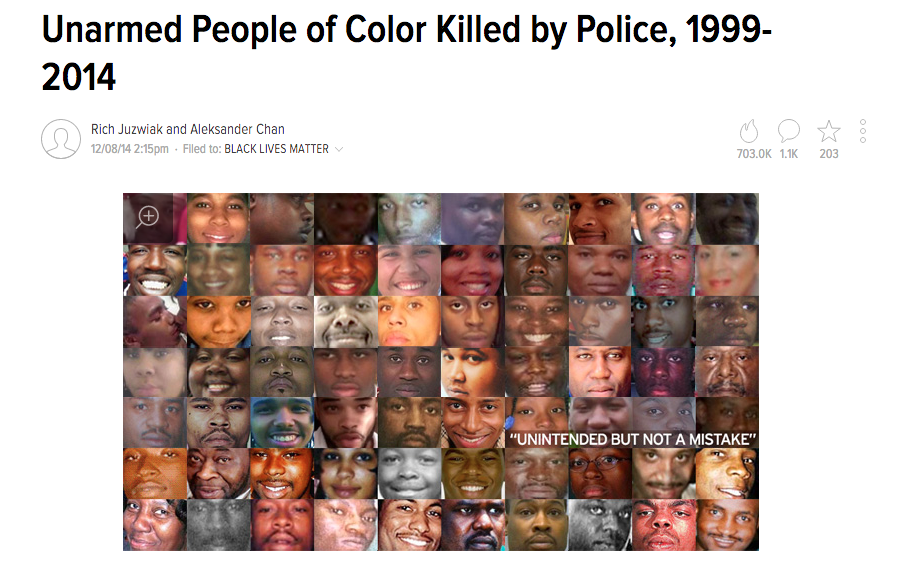
The incidents that drive the protests and organization of Black Lives Matter are largely focused on the police use of lethal force on unarmed blacks. See some of the stories behind the data and headlines here. The figure below shows the total annual number of unarmed people of all races, genders, and ethnicities killed by police from 2015 to 2019. Since 2015, the number of unarmed people killed by police has clearly declined.
We can look at the distribution of race and ethnicity among those that were killed by police while unarmed in a couple of different ways. The first is to look at all those who were unarmed when killed and, within that group of victims, examine the racial and ethnic distribution. The figure below does this. Each bar represents 100% of the people who were unarmed when killed by police that particular year. Each bar is then proportionally divided by race-ethnicity. In 2015, 34% of those who were unarmed when killed by police were white, 40% black, and 20% Hispanic. The percentage of whites among this group of unarmed victims increases to nearly 49% by 2018 while the portion of blacks decreases to 36% and Hispanics to just under 15%. Again, 2019 data should be approached with caution due to the dramatic increase in victims in the database with “unknown” race or ethnicity. Just as with the ratio of all those killed to the proportion of the US population, while whites make up the highest percentage of those that were unarmed when killed by police, blacks remain overrepresented in the group relative to their proportion with the US population. Whites and Hispanics remain underrepresented among the victims. I focus on these three racial-ethnic groups because combined they account for nearly all those killed by police while unarmed.

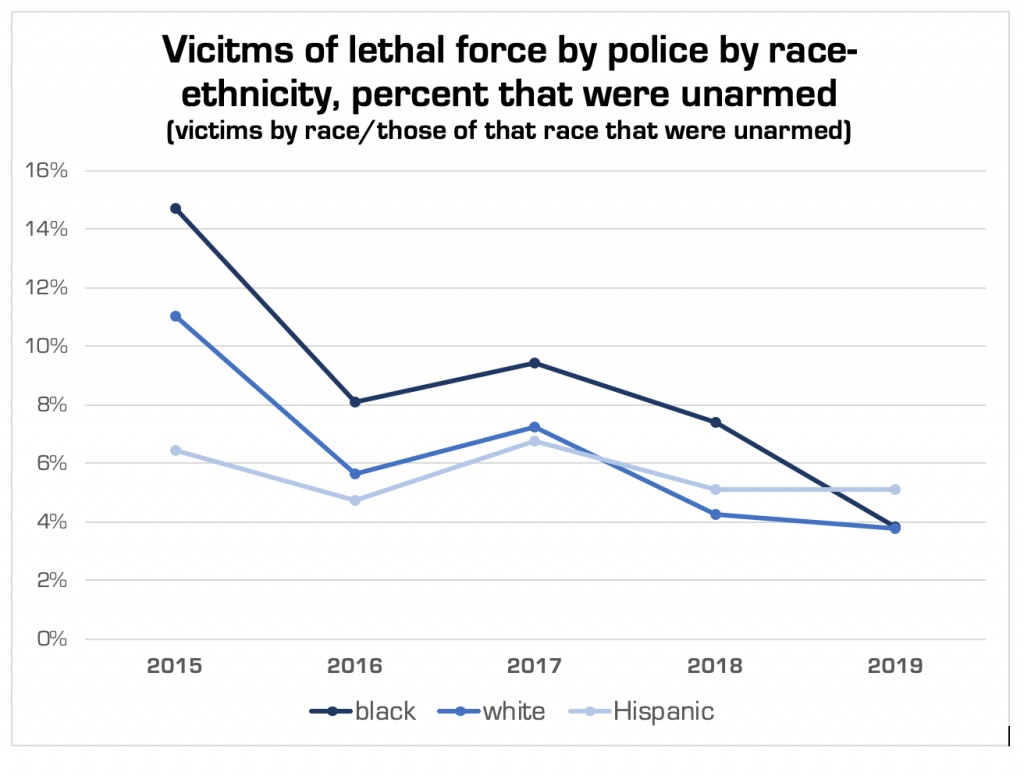
The other way to examine the distribution of race and ethnicity in relation to the police use of lethal force on those that were unarmed at the time is by looking at the proportion of all those that were killed by police by race and then look at the proportion of each race that was unarmed when killed. The figure below does just that for whites, blacks, and Hispanics. Each line represents the percentage of victims of that particular race-ethnicity that were unarmed when killed. So, in 2015, about 15% of blacks that were killed by police were unarmed. About 11% of whites killed by police were unarmed and a bit more than 6% of Hispanics killed by police were unarmed. In 2016 and subsequent years, there is a visible decline in the percentage of victims of each race-ethnicity that were unarmed when killed by police. 2019 appears to show near equal percentages of each group being unarmed when killed by police. Counts rather than percentages show that in 2019, 9 blacks, 19 whites, and 6 Hispanics were unarmed when killed by police. In 2015, 38 blacks, 32 whites, and 19 Hispanics were unarmed when killed by police.
Mapping Police Violence puts it this way (using their similar but not exactly the same data):
In sum, the number of unarmed people killed by police declined after 2015. Arguably, with a well-trained police force, this number should be zero. While whites constitute both the highest number and percentage of those killed by police and those unarmed when killed by police, they also make up a majority of the population in the US (~60% non-Hispanic white in 2019). Blacks are disproportionately impacted by the use of lethal force by the police relative to the general population. Blacks continue to make up a disproportionate number of all those killed by police and the number of those that were unarmed when killed by police. If we look at the victims of police lethal force by race in 2019, a similar proportion of the whites, blacks, and Hispanics killed by police were unarmed when killed.
While this is not the only issue that The Movement for Black Lives and Black Lives Matter focuses on, it is key. Their efforts (organizing, protesting, advocating, etc.) have driven some policymakers and some police departments to take note and take (some but not enough) action to reduce the use of lethal force. While the data indicates that the problem of police lethal force clearly remains racialized, there are signs that incidents of lethal force by police are decreasing for those that are unarmed.
Teach well, it matters.
Follow Sociology Toolbox on Twitter and Facebook
…
How can we improve police accountability in the US?
Other excellent resources on the topic:
Click on the images below to be redirected to web pages or articles.
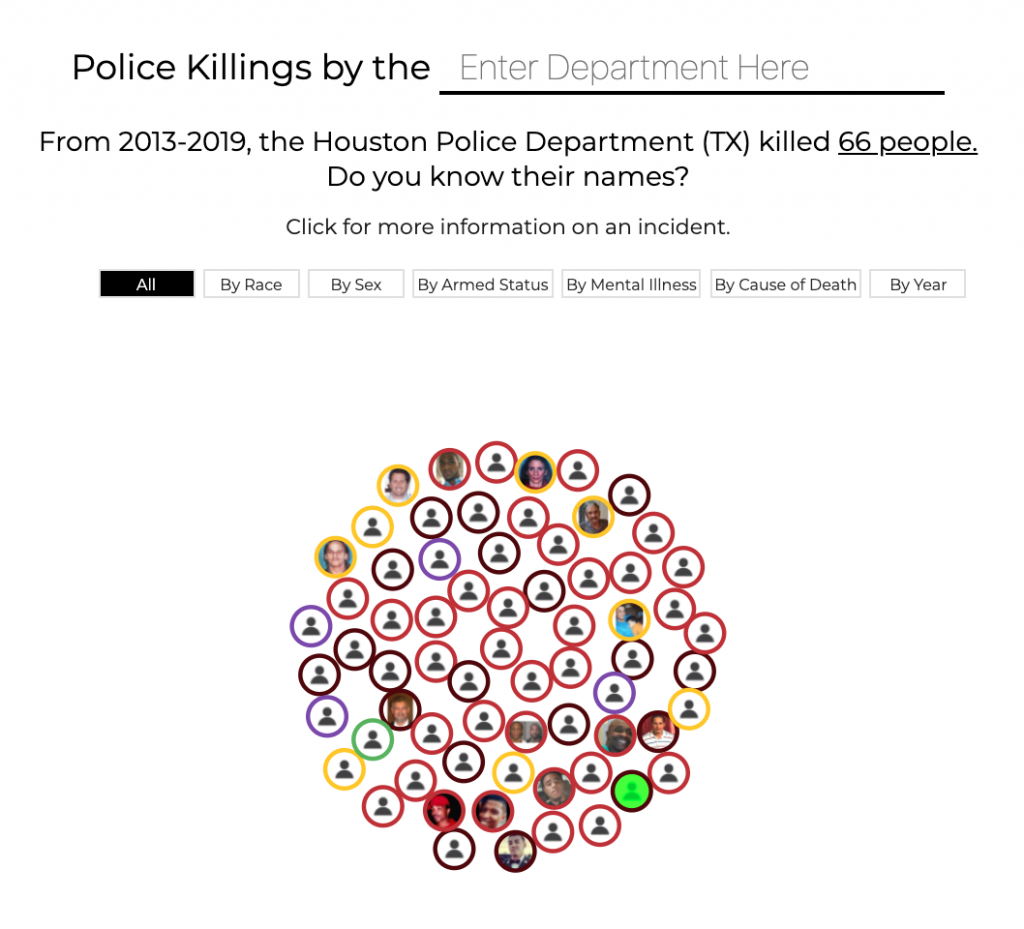
Search a specific police department on Mapping Police Violence‘s tool:
. . .
Here is an attempt at documenting all the unarmed people of color killed by police from 1999-2014
Also, see some of my other related posts on this topic (click on the titles below to go to the full post):


. . .
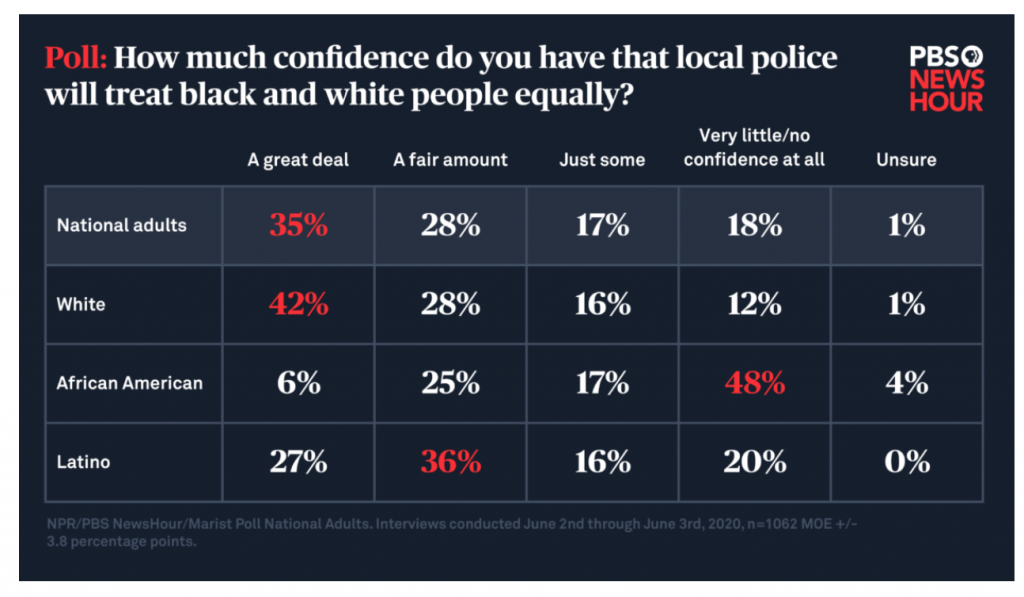
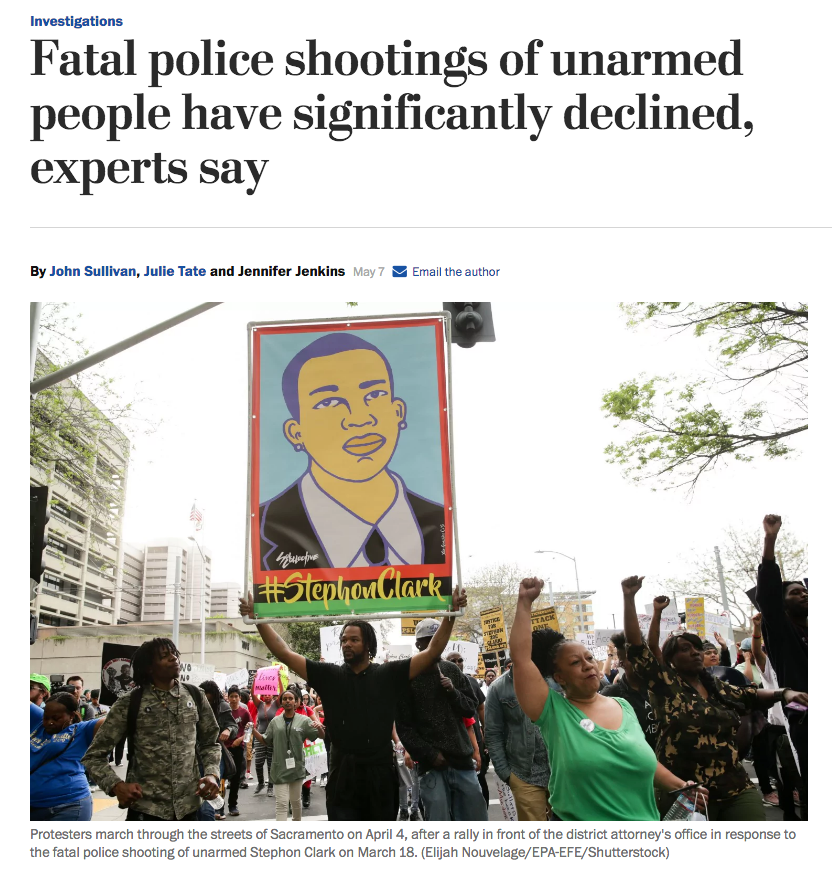
Click on the image below to go to the full story and polling data
. . .
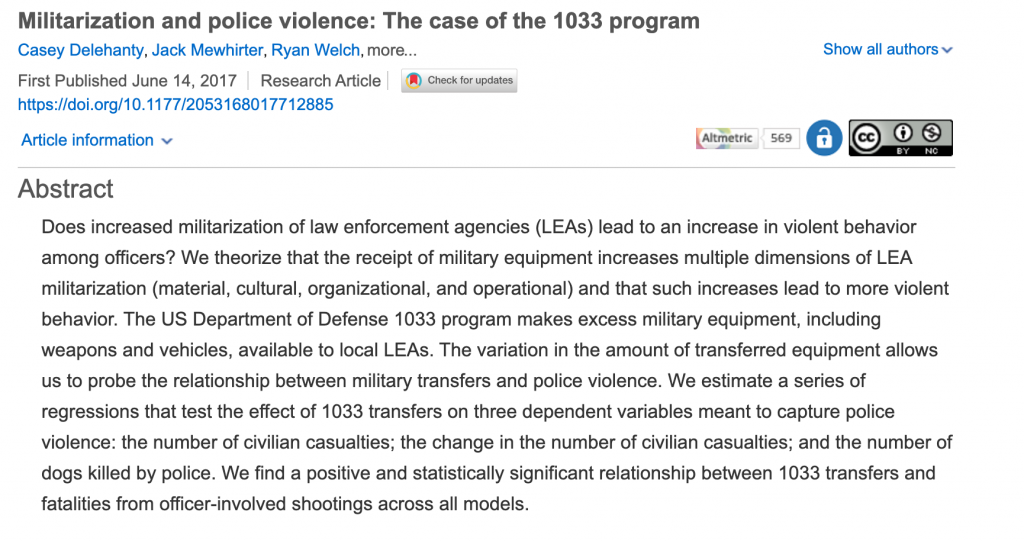
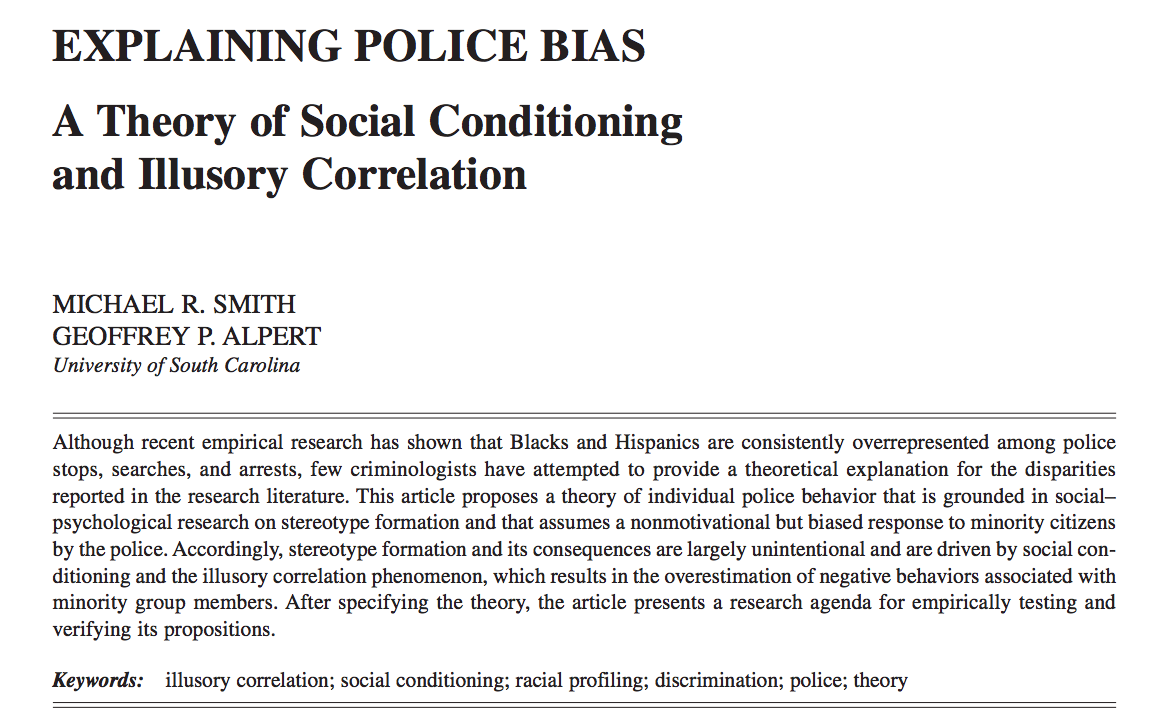
A recent study arguing that the militarization of the police helps neither them nor the community’s view of the police. Read more here
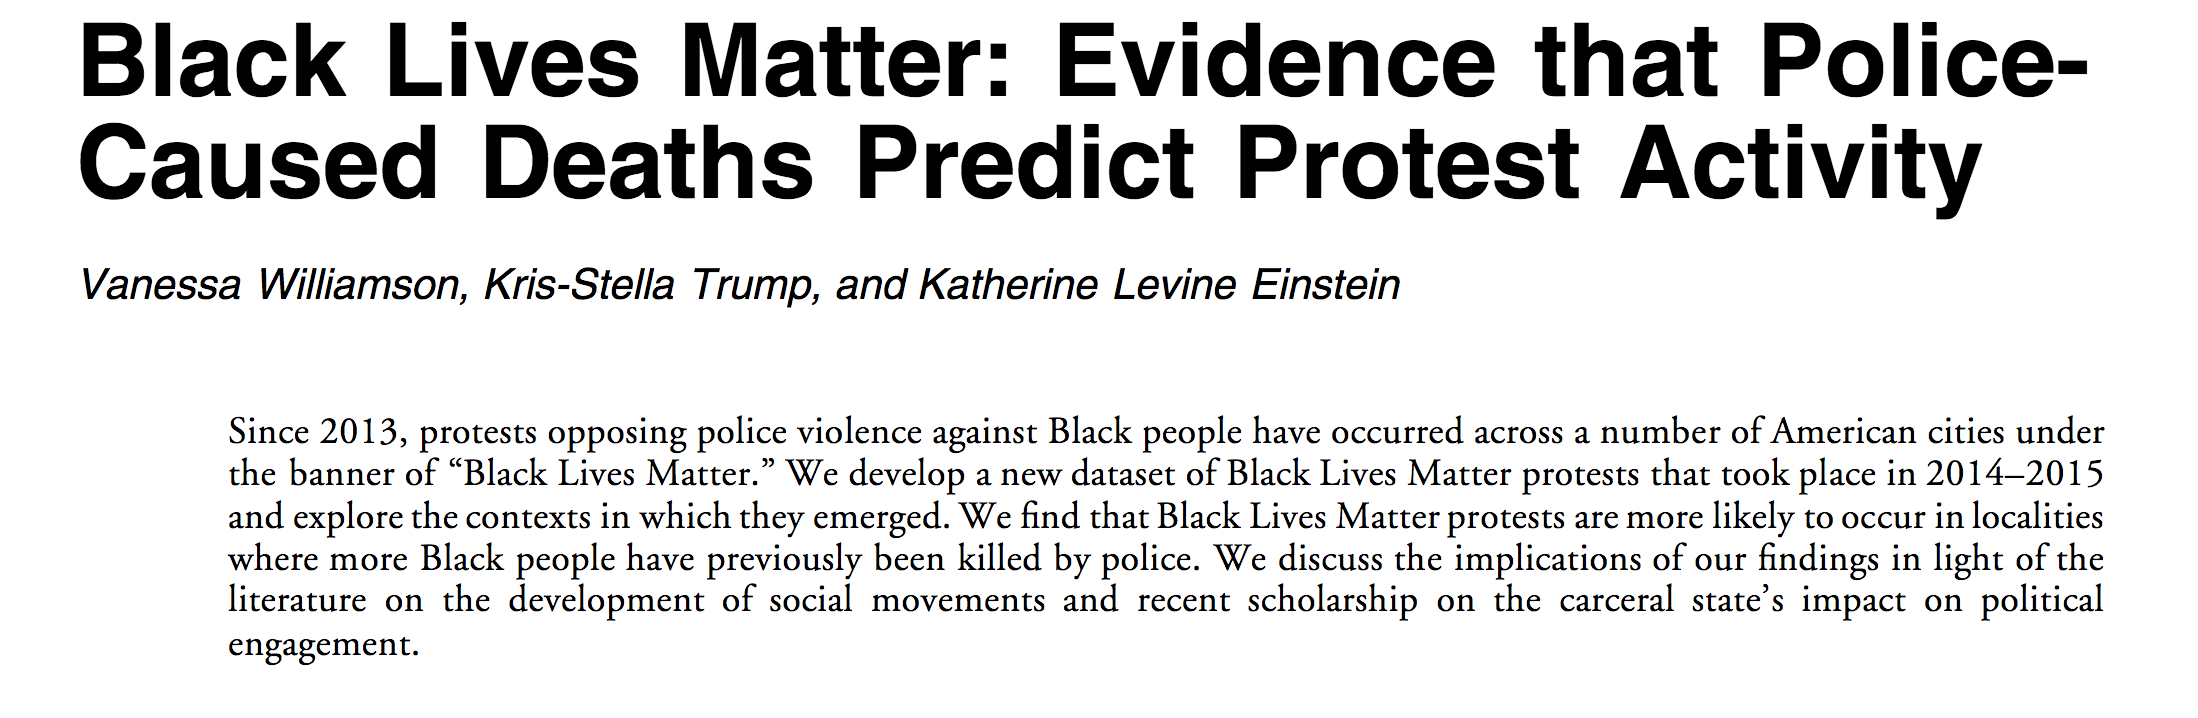
A recent article on the predictors of Black Lives Matter protests. Click on the image to link to the full article.
. . .
. . .
. . .
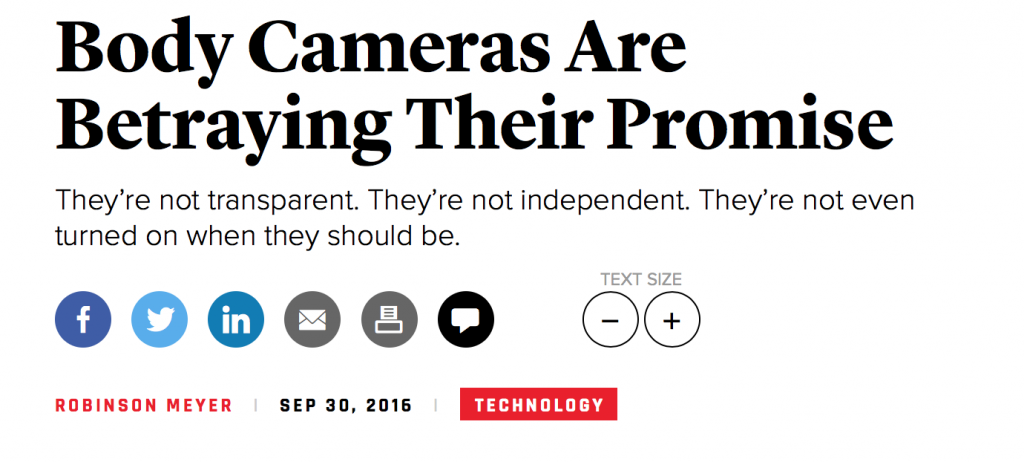
“Instead of making officers more accountable and transparent to the public, body cameras may be making officers and departments more powerful than they were before. … First, many officers are (either earnestly or conveniently) forgetting to activate their cameras when they’re supposed to. Take the case of Terrence Sterling, an unarmed 31-year-old black man who was fatally shot this month by local police officers in Washington, D.C., after his motorcycle crashed into their car. Contrary to District of Columbia policy, no officer at the scene activated their body camera until after the shooting. The city released footage of Sterling’s final moments this week—but that video begins more than a minute after shots were fired. …. The third threat is that many states have introduced or passed new laws that restrict public access to footage while preserving police access.”
. . .
The federal government will soon require police departments and law enforcement agencies to report information on the deaths of any citizens when interacting with police – during a traffic stop, after an arrest, in jail, etc. The data will be gathered quarterly and will hopefully address any gaps in the data that others, like the Guardian above, have tried to fill.
. . .
Also from last year, an article exploring the weakness in the FBI data on civilians killed by police. Click on the image to be linked to the full article.
. . .
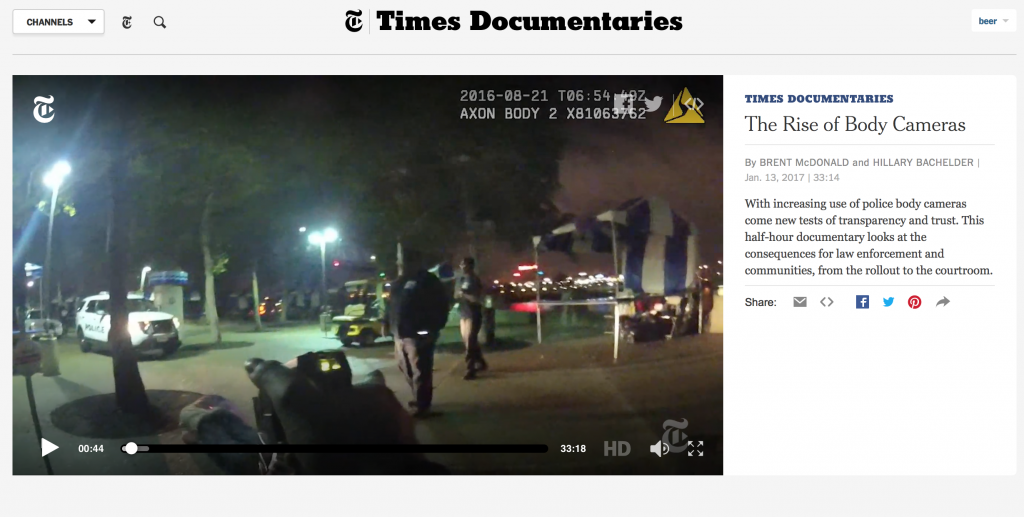
“With increasing use of police body cameras come new tests of transparency and trust. This half-hour documentary looks at the consequences for law enforcement and communities, from the rollout to the courtroom.”
. . .
Comments 148
Dr. Scott Speed — July 1, 2016
Thank you for this data. I'm going to be using it on my Race Haven Podcast. Race Haven is solution focused dialogue about race relations in America.
Lori campbell — July 7, 2016
Thank you so much for this. Really good example for how to teach statistics using real data.
Jeff Brown — July 7, 2016
Using your logic men are killed at an alarming rate compared to their proportion of the population(95% of victims vs about 49% of population). Where is the outcry? You'll then point out I am using the wrong denominator because men commit more crime, are more violent, and therefore are more likely to be confronted by police. Possible you got the other denominator incorrect? When is the appropriate denominator. It sure isn't percent of the general population.
Anonymous — July 7, 2016
I would be interested to see someone drill a little deeper into this dataset. In particular I think it would be worthwhile to look racial makeup of victims vs total population within a defined geographic location ie. City or neighborhood where the killing took place. The stats above would be more relevant if racial makeup was a normally distributed population across the nation. It seems to me that narrowing our area of interest (within reason) would remove some potential bias from the analysis.
Andrew — July 7, 2016
What is the breakdown of number of crimes REPORTED in black, white, hispanic etc neighborhoods.
Jahaa — July 8, 2016
THANK YOU! The next time someone says that African Americans are the only innocent ones getting gunned down by police I'll be sure to show them this!
Paul — July 8, 2016
I found this because in the wake of the killing of Philando Castile, somebody shared it on Facebook with the caption "Data doesn't lie." Data doesn't "lie" but it can easily be misinterpreted. I'm not a sociologist, statistician, or PhD, but I have some comments to offer.
The author's conclusion, based on the data, is "This data further solidifies the concerns and demands of the Black Lives Matters movement; there is a pattern of police using deadly force disproportionally on blacks that needs to be addressed by policy makers and police departments across the nation."
But that is an interpretation superimposed on the data; the data doesn't explicity say that, and is actually insufficient to support that claim. (Note that I am not saying the claim is false, only that the data as presented isn't enough to prove it.)
An equally valid interpretation, according to the author's methodology, is that "there is a pattern of police using deadly force disproportionally on MALES that needs to be addressed by policy makers and police departments across the nation". After all, the data show that "Most, 95.2%, of those killed by police in 2015 were men. The pie chart below shows that only 4.8% of the victims identified as anything other than male." That is a far greater disproportion than the racial breakdown.
So what gives? Obviously there must be some additional factor(s) not used in the correlation of the data. The author gives a hat tip to it. But he doesn't factor it in before reaching a conclusion. Among those killed by police - of any race, of any age, by any means - what were the circumstances? Was it during the commission or investigation of a crime? Did the victim resist? Did the officer happen upon the victim, or was he responding to a complaint? Was it sunny and clear, or dark of night? What was the race of the officer?
In these emotionally-charged times, please do not think I am trying to excuse unwarranted killings by police; they should be investigated and justice should be served. But faulty analysis - especially when presented as self-evident "data" - doesn't help the situation, it can only lead to the wrong solutions.
Dru Williams — July 8, 2016
Flawed. You need to show the crime rate in each category.
Jonathan Neufeldt — July 8, 2016
So, you are comparing people killed by cops in 2015 to population census data from 2014. Why not compare data from the same year? Are you sure there are more hispanic/latin americans than blacks in the US? I want to see the raw numbers, not just race/ethnicity proportions (i.e. percentages) of US population.
Sandra johnson — July 8, 2016
This data is meaningless without including statistics to address the percentage of each race committing crimes. If a particular race is
JJ — July 8, 2016
I looked at the article, but did not read the whole thing. Did I miss the stats on the percentage of violent crime committed by each of the listed ethnic groups compared to their percentage of the population?
C. Todd — July 8, 2016
now, show data about crime rate by race...you will get an answer for why the percentage is so high for black deaths...they simply cause more crime.
Dr Terri Friel — July 8, 2016
Nice work.
bly — July 8, 2016
Why are you comparing The Guardian's data to general demographics instead of those who have been approached by the police?
Patrick Harding — July 8, 2016
There are statistics on a vast array of scenarios here, but I was curious as to whether statistics are kept concerning the killing of police by people of different ethnic backgrounds. Could you steer me in the right direction?
Jamal Washington — July 8, 2016
Certain racial groups are charged with more crimes by our justice system and have frequent police encounters. How does this not weigh into this "exhaustive" study.
John Norvell — July 8, 2016
Unless, I'm missing something, if the object is to prove whether race matters in a lethal encounter with the police, the important data point is not the percentage of each ethnic/racial group in the the total population, but their representation in encounters with the police. That is, how many Whites, Blacks, Hispanics, etc. were stopped by police and not killed. I doubt that data is easy to come by. I'm pretty sure blacks have proportionally more encounters with police than Whites in the US (which may well indicate structural and direct racism among other factors), so this may account for at least some of the disproportion with respect to the total US population. No?
oldgoldtop — July 8, 2016
I disagree with the author's implication that the differing shooting rates is largely a result of police racial bias (as claimed by Black Lives Matter). Blacks, due to socio-economic reasons, have much higher rates of police interaction, due to the high crime areas so many find themselves living. (stemming from destructive gov programs IMO). This much higher interaction will lead to higher rates of violent encounters that result in police use of force. The perception of police oppression can further be expected to create a more hostile environment and result in further escalation of resistance. In fact if you consider arrest and incarceration rates by race, you would expect the death rate among blacks to be much higher.
Note again that nearly twice as many whites were killed as blacks.
Don Masselli — July 8, 2016
By limiting the data to race relative to percentage of population, this study ignores factors that may lead to quite different conclusions. The study shows that, "compared to their portion of the overall population, blacks are disproportionally the victims of lethal force by law enforcement officers, even when they are unarmed." What if the population figures were limited to the areas where most killings take place? If most law enforcement killings take place in inner cities and the population there is predominately black, then this might account for the increased percentage of black deaths.
What about population percentages relative to crimes? Are there more police shootings in areas with very high crime? Are blacks disproportionately represented in high crime areas, and therefore more likely to be victims of those shootings? And what percentage of the black killings were by black officers (and vice versa)?
By focusing solely on race versus general population, this study implies that police shootings are racially motivated. If other factors are considered a different picture may be presented. And if a distorted or incorrect cause for these killings is reached and accepted by the public and those in government, steps that are taken to correct this problem will not only be ineffective, they may worsen the problem.
Something has to be done, but basing policy and law on incomplete and potentially incorrect studies is not going to solve anything. The authors of this study should be looking at all the potential possibilities, rather than settling for the easy one.
I would hope that truth was more important.
Boomiois — July 8, 2016
Now, please, do a study on race and crime. The two go hand in hand. It is clear blacks are disproportionately the victims of lethal force but someone needs to answer the question of WHY. The answer is far more complicated than racism. The answer lies somewhere in a muddled concoction of history, fading racism, poverty, and crime. Before we can EFFECTIVELY address and resolve the problem, we as a nation need to understand the cause.
Edward zapala — July 9, 2016
Thanks for sharing this disturbing (but important) analysis), Todd. I had a read a similar piece recently (sorry, can no longer locate) that suggested the underlying racism if our society was more to blame (people of color were more likely to be living in high-crime areas, for example) then racism of police. Thoughts?
D — July 9, 2016
Where in your article did you mention that blacks comment a higher disproportionate amount of violent crime? Does that not explain why the police are many more times likely to confront Blacks than whites?
Rhonda — July 9, 2016
Wouldn't it be more accurate to compare the percentage killed against the number of interactions with police instead of overall population? The general population totals include ages 0->100, disabled or otherwise incapacitated, etc. A large portion of the population does not interact with law enforcement at all or only in situations of a benign nature. I believe it would be more accurate to look at the numbers involving situations where police became involved due to the probability of laws being broken, threats of violence, etc. What is the percentage of police involved situations that turn violent and/or deadly? What about the race of the officers, not just the suspects involved? These are the numbers that would truly reflect a problem with race by law enforcement.
Ron Gulch — July 9, 2016
Excellent article. Being in a technical field we always look to root causes to slice problems. I would expect Dr. Beer to dig deeper in to the causes of disparity found by race and not simply assume racism as the cause. Compare these numbers against the race of police officers involved; Perhaps a review of crime statistics by race as published by the FBI and marry the 2 data sources to build evidence based hypothesis before jumping to a conclusion. I have done this and have a hypothesis that police are not 'racist' because of society but because of personal experience on the job and have been conditioned subconsciously to have biases tied to the offenders race. Such that race becomes an intermediate marker as to the causal. In the high level data this presents itself as apparent racism by police , regardless of the race of the officer. Police have a very difficult role and should be given training to help individualize thier tactical response. On the other hand addresses causes of crime in specific populations at a root cause level would address the other side of this issue. Oversimplification doesn't help solve the issue.
Regards,
Show Me Skeptic — July 9, 2016
"If we lived in a society where one’s race had no impact, then we would expect to see the portion of each racial/ethnic group killed by police equal to that of the portion in the general population. "
The thesis is flawed. There are two critical stats that are missing in order for the thesis to hold:
1) the proportional rate of crime per group (more crime = more run ins with police)
2) the race of the shooting police officer.
The authors given data processing the old expression, "there are three kinds of lies: lies, damn lies and statistics.
M. Treanor — July 9, 2016
As so many have said in replies, although not as directly as I will, this analysis of the data is misleading and is confounding our understanding of the situation. As a result, it is making everything worse. To repeat a point that was stated by a few, the prevalence of males in the list of "victims," by this same simple logic, would "prove" that the police hate men. The fact that the data cannot be normalized by several important but unrecorded factors is not justification for ignoring these factors. The author unwittingly escalates matters by encouraging all people of color to identify with violent criminals who confront police. This simple treatment combines with anecdotes of truly poor judgment by police to reaffirm a preconception that makes no sense: police everywhere hate black people.
FM — July 9, 2016
Would be good if you also added the perspective from a police officer. A Police Officer makes up 806k of the population and had 130 death while on the job. It certainaly is another perspective.
JK — July 9, 2016
It only makes sense to use the number of interactions with police as the denominator in this case, IF you assume that would be an unbiased sample. Which it's not. Profiling begins far before a person is killed. Profiling is part of the reason that blacks are killed at higher rates - because law enforcement believes that they are more dangerous from the start.
By the way, this is also the reason that men are killed more often than women. Law enforcement officers think men are more dangerous from the start - similar to the way they think black people are more dangerous. Obviously there's a bias there too. That doesn't invalidate the original claim - it's a separate but related issue.
Stephen Kliewer — July 10, 2016
So many of the responses above show that people still want to believe that those who were shot deserved it. In short, their presupposition, while accusing the article of having an underlying bias (which I think it does) is that more blacks are shot because more blacks (per percentage of the population) are involved in crimes and violence. I think we still really, really want to excuse a systematic problem because it doesn't line up with our view of what America is about. This is called denial. I think (I work in mental health) that there is such a thing as an addiction to power (think domestic violence), and that too many people are drawn to law enforcement with its guns and power, who have this addiction. The over use power because the use of power is a drug. This group needs to be weeded out. If they are not, they endanger all the good people who are part of the police community. And they endanger all of us. I think the disparity is significant. Some deviation in % can be explained away, but when the rate is double? However the most startling statistic is simply the raw number of American's killed by those charge to serve and protect. Open carry is making this number rise (a policeman will shoot quick with less provocation if the other has a gun, legally or not). But we must address the number of people killed, white, black, asian, hispanic...all
Kevin luttrell — July 10, 2016
The article does not take in to account that crime rates affect police
Casandra — July 10, 2016
Given the history of the US I'm sure there is racial bias in the way the law is enforced. But comparing deaths vs. % of general general population is simply insufficient to draw firm conclusions about racial bias. What about other contributing factors to the deaths? How many attempted arrests involved a struggle? How many deaths were related to reports of violence by the suspect? How many acts of violence against police are committed by each race? It's a complex topic, but to really figure out solutions and prevent people from dismissing the data, you have to conduct a more thorough analysis.
Veronica Billups — July 10, 2016
I see many are trying to edge in the criminality by race. I guess then, maybe it will go into educational and economical disparities and inequalities since we're still seeking to vilify blacks on the basis of supposed higher criminality. Nice try. Amass ALL the data since we got off the boats in stolen America and you'll still come out having to swallow the pill you run from.
Devin — July 11, 2016
Thank you for putting together this page, super comprehensive and much-needed. The only tweak I would make is to the column in the first table labeled "percentage of THOSE killed by police." It's not wrong, but it could be more clear to distinguish "those" since it can construed as "the percentage of people of ___ race that were killed by police with respect to the total number of people killed by police." -Or- "the percentage of ___ race that were killed by police." Obviously it's the first and not the latter because 50.1% of all white people weren't killed by police...However, the second is an interesting statistic as well that I was looking for, specifically, and the title of that column in that chart threw me off upon first glance...a minor critique for an otherwise excellent statistical study.
Rick — July 11, 2016
I must beg to differ with the professor. His data is skewed.
Where his numbers are flawed is he is comparing incidents with the general population. He fails to understand it must relate to the criminal population in contact with the police.
Until they do that these numbers will be flawed.
1 — July 11, 2016
Where in your article did you mention that blacks comment a higher disproportionate amount of violent crime? Does that not explain why the police are many more times likely to confront Blacks than whites?
Where in your article did you mention that blacks comment a higher disproportionate amount of violent crime? Does that not explain why the police are many more times likely to confront Blacks than whites?
Where in your article did you mention that blacks comment a higher disproportionate amount of violent crime? Does that not explain why the police are many more times likely to confront Blacks than whites?
Rachele — July 12, 2016
– FACT: Despite making up just 13% of the population, blacks commit around half of homicides in the United States. DOJ statistics show that between 1980 and 2008, blacks committed 52% of homicides, compared to 45% of homicides committed by whites.
More up to date FBI statistics tell a similar story. In 2013, black criminals carried out 38% of murders, compared to 31.1% for whites, again despite the fact that there are five times more white people in the U.S.
– FACT: From 2011 to 2013, 38.5 per cent of people arrested for murder, manslaughter, rape, robbery, and aggravated assault were black. This figure is three times higher than the 13% black population figure. When you account for the fact that black males aged 15-34, who account for around 3% of the population, are responsible for the vast majority of these crimes, the figures are even more staggering.
– FACT: Despite the fact that black people commit an equal or greater number of violent crimes than whites, whites are almost TWICE as likely to be killed by police officers.
William — July 13, 2016
It would great to see this data sorted by City/State/Region. In my area you do not hear of the Police killing any unarmed people and we do have several cities with poverty and large pubic housing complexes.
How many Police forces do things the right way and are there clusters of areas where excess force is used?
Donielle — July 15, 2016
Rachele: Capitalizing the word "fact" doesn't make the information factual. None of the statements are accurate. It looks like you blended an argument you've heard about disproportionality, with the actual commission of crimes. The major issue is inequities in sentencing and the use of plea deals with the most vulnerable communities in the US. For actual facts, see Michelle Alexander's The New Jim Crow, she did really excellent work explaining these distinctions, and also several chapters of Bryan Stevenson's Just Mercy discuss disproportionate sentencing in great detail.
Psychology can help us understand the warped logic of revenge — Quartz — July 17, 2016
[…] number of people continue to doubt that African Americans are disproportionately killed by police, although recent data from the University of Minnesota suggests […]
Our Police, Ourselves – Toward Health — July 20, 2016
[…] A data set collected by The Guardian revealed a similar result. […]
“BUT BLACKS COMMIT MORE CRIMES”: Scholars discuss conservative logic - Sociology Toolbox — August 9, 2016
[…] used reader reporting to keep track of the incidents where police used lethal force on citizens. See some analysis of the 2015 data in a previous post on this blog. Also see a classroom assignment for teaching […]
Tristen Sanchez — September 1, 2016
Okay blacks are 12-13% of the population but are responsible for 50% of all crime, so they do not get killed at a disproportionate rate of those who are white!
MICHAEL WESTBROOK — September 5, 2016
Certain racial groups are profile but thats profile I dont think the numbers are right
Joey — November 25, 2016
I find no flaw with your numbers, BUT, I just want to ask, when using this per capita analysis to make the comparison "fair", how come I never see it used to show why, out of homicides committed every year, ( forgive my lack of actual numbers ) that very similar numbers exist for the murders committed/ I believe it was 2015 that I had read those figures, and it was around 2,700 murders committed by BOTH races, they were within a few hundred of each other, and only 189 blacks were killed by whites, and 400 or so whites were killed by blacks, but why such a high number of murders by blacks on blacks "per capita"? They are such a small portion of the population, then why do they commit as many murders as whites?
TOOLS FOR TEACHING SOCIOLOGY: Teach well. It matters. - Sociology Toolbox — December 7, 2016
[…] POLICE KILLING OF BLACKS: Data for 2015 Download charts that examine the race, ethnicity, age and other characteristics of people killed by police in 2015. (2016 data will be released in early January) […]
Lamentations And Resolve In the Wake of Trump’s Win | Post-conservative Orphan of God — December 21, 2016
[…] disproportionately harassed, fined, shot, detained, convicted, and/or imprisoned by police; often for offenses committed in equal […]
Paul Shipton — October 9, 2017
Who commits the most Crime? Allocation of LE resources suggest the greater LE representation should be in areas where the most crime is committed. Second the greater threat due to crime. Lastly, politically sensitive areas. Blacks represent the smaller minority of unarmed lethal force however, they represent the largest demographic of criminal expectation. Therefore it is more likely that an LE officer will expect a black to engage in crime, even deadly crime in an area known for crime and would be justifiably so. This is rational not emotional. Race should not be a factor in unarmed deaths of bystanders as they were not the intended target
Shawn Frakes — October 13, 2017
First I dislike the article quoting second hand statistics. Secondly the more interaction any racial group has with law enforcement the greater likelihood of a shooting incident occurring. The data and any conclusions need to reflect that.
Michael E Murphy — October 18, 2017
Blacks are 13.2% of the population according to the article but nowhere in the article did they shoe DOJ figures showing that blacks commit more than 50% of homicides in US as well as a disproportionately larger number of violent crimes. They are also often poor and do more likely to commit crimes involving violence like drugs, mugging sand murder. In my life I have been mugged three times - twice by blacks and once by Hispanics - no whites. This goes a long way to explaining the increases interaction with police and more violent interactions.
Chance McGerk — January 1, 2018
Nationwide, the Black Homicide Offender Rate soared under Barack Obama from 10.8 to 12.4 murders per 100,000.
That makes the black murder rate 9-times HIGHER than "white America".
In sewers like Baltimore and St. Louis, the murder rate is 40-times HIGHER than "white America".
Ron Apollo — January 11, 2018
Here is what everyone is missing.
1) in every chart more whites were killed by police. (period)
If more whites were killed how does that make blacks the most killed of everyone?
2) everyone is saying that the crimes committed by blacks is way higher than that of whites.
So black people have more run ins with the police.
NOW CHECK THIS OUT!! I
f white people have less run ins with the police and more whites are killed than blacks.
That means that whites are more likely to be killed not blacks.
Because if blacks say (for example) have twice as many run ins with police and have fewer deaths than whites.
The run in to death ratio is higher for whites.
It doesn't matter what bias you have if one group has more dead than the other the one with the most dead is the one with the most dead.
Simple as that!!
if I have a million dollars and you have one hundred. even if I have more than triple the amount of people in my family than you.
I still have more money than you.
and it doesn't matter if you see your family more often than I do.
if I have more I have more.
so more dead in one group does not ever make the group with less dead have more dead.
578 white people killed and 301 black people killed=779 people (humans)
that were basically murdered by police.
that is the issue!!
we wont get nothing solved if instead of addressing the fact that humans are being killed
we want to argue over who is getting killed the most
then we stay stuck trying to figure that out instead of coming together and finding a solution to how we prevent humans from being killed by police unnecessarily.
I think it is by design that these articles are written
because if you notice they first separate us by race
then they separate us by political party.
cause in this article there are articles saying the conservative logic on this issue and liberal this and conservative that.
it's all done to keep us chasing our tails and arguing over race and political party and never addressing the loss of human life.
it's called divide and conquer.
we need to unite and win or we will be arguing over what race gets killed more for another 10 years.
lets just stop the unnecessary killing of unarmed humans.
because if we just focus on that then less of every race will be killed
it only makes sense if we stop the killing less of every race will be killed.
the way I see it if 1,000 white people get killed and only 1 black person it is still 1,001 humans that should not have been killed and it doesn't matter who lost the most to the ones who lost someone they loved.
no unarmed human regardless of any other factor should be met with deadly force by a firearm. (unless the person is in the process of killing someone with their bear hands)
there's only one race and it's called human.
Derek How — January 16, 2018
Kind of interesting how nobody is addressing that elephant in the room ... that 'blacks' account for 27% of the victims .. but only account for 13% of the population ...
So .. why do blacks account for such a large amount of the country's crime?
Greg — February 25, 2018
Maybe the fact that 133 blacks shot other blacks LAST WEEK in an 8 square mile area of Chi can answer some of these questions.
Eric — March 23, 2018
Go back to police carrying only night sticks.
jimmy — May 14, 2018
Inner city american blacks are just dumb nasty animals, cant ignore what I see in documentaries on america, they dont hide it. Every dead one of them is another teenaged girl safe from rape, and teen boy safe from getting violently robbed. Think on that, chumps
Phillip Holbrook — May 24, 2018
This "report" is itself clearly biased. For example, when figures of those killed who were unarmed are given, the writer says the blacks and Hispanics were "completely unarmed." When unarmed whites are mention, the writer simply called them "unarmed" and omitted the adverb "completely." Is there another definition of unarmed than unarmed. Were the blacks and Hispanics more unarmed than the unarmed whites? It's a simple glaring inconsistency in the "facts" of this racist article.
Hassan Muhammad — June 3, 2018
Gunfight at the O.K. Corral:
The Gunfight at the O.K. Corral was a 30-second shootout between lawmen and members of a loosely organized group of outlaws called the Cowboys that took place at about 3:00 p.m. on Wednesday, October 26, 1881, in Tombstone, Arizona Territory. Wikipedia
Location: Tombstone, Arizona Territory, United States
Date: October 26, 1881
Total number of deaths: 3
Result: Virgil and Morgan wounded, Holliday grazed; Tom and Frank McLaury and Billy Clanton killed
Participants: Virgil Earp, Morgan Earp, Ike Clanton, Tom McLaury, Frank McLaury, Billy Clanton, Billy Claiborne
This Police Shooting in Arizona 1881 was understood when they fought against armed outlaws resisting arrest.
But, the 4th Amendment of the United States Constitution concerning probable cause being required for search and seizure is too often ignored by Law Enforcement Officers. The Courts have not examined this fairly and justly on many occasions. This will result in more protests by the Community and less cooperation by the Public when Law Enforcement need help to solve crimes.
Police Shooting of unarmed civilians is illegal. They should pull-out a Notebook and Pen and question the person about their location and activity.
Issue respectful and courteous advice on where the person can receive Social or Financial help in the community.
If illegal activity has occurred, than issue a Traffic Ticket to appear in Court or call a Supervisor for assistance.
Exception, when a violent crime is in progress like a Bank Robbery, Store Robbery, Illegal Drug Sale, Attempted Rape or Sexual Assault or Sex Trade, Kidnapping, School Shooting, Gang Fight, etc...
Conclusion, in the 1960's in New York City there was a wonderful program called the Police Athletic League (PAL). Helping kids with different sports during the hot summer and issue many colorful team shirts for Basketball, Baseball, Football, Track and Field events. They would have Police volunteers organize teams in each neighborhood to play games and the winning teams receive trophies / medals. Police, Sherriff and Marshals across the United States are now experiencing negative Public Relations reports and this is not good for our country.
Cathie — July 27, 2018
The number one cause of police shootings is not racism. It has nothing to do with the color of one's skin at all in fact. It has nothing to do with percentages of race within the population, percentages of whose committing more crime. It has to do with one simple thing: compliance, or lack thereof. If you are compliant with a PO's commands 99% of the time you will walk away; you may go to jail or get a ticket, but you will walk away. The other 1% accounts for actually bad cops, of which there are fewer than we would like to believe for some odd reason.
Billie M — August 11, 2018
It is pertinent to look at the correlation of number of crimes committed/shot by police/%population. Blacks are 13% of the population committing 62% of the crime with 25% of total shot by police vs. whites that are 63% of the population committing 28% of the crime and yet are still 58% of those shot by police. The statistic I couldn't find was the actual % of blacks shot by police vs. the total number of crimes committed by blacks. Maybe I just missed it but I doubt that it's anywhere near 25% of all blacks charged with a crime anymore than 58% of all white people committing a crime are shot by police. Maybe all of the wannabe thugs should stay out of those situations by NOT COMMITTING A CRIME! Just a thought.
Donna — August 13, 2018
Wow this was so educational for me , not the article because I found it bias , but the comments I learned so much . Thank you for so many insights.
Shawn Charbonneau — September 4, 2018
Main point I see that is flawed. The author needs to go down and do some leathal force training, especially edged weapon training. He states cops should only use deadly force when encountering someone with a gun. An edged weapon is as or more dangerous than a firearm. The perp can conceal it better even when deployed. A subject with an edged weapon in hand standing at a distance of 25 feet from a cop can close that distance in under 3 sec. so a cop has to draw his weapon from a triple retention holster and try and get a shot off. Yes many hours by officers train for that. But you still have to be lucky.
That really smart guy — September 11, 2018
Your conclusion is flawed, the true measure cannot be determined by using absolute numbers(total population percentages). The true measure comes from how many police encounters by race. Not every citizen of each race has encounters with police. If the total encounters are equal or very similar then whites are more likely to be shot. Last I checked on the fbi database whites and blacks commit roughly the same amount of crimes while other non whites commit fewer, and the same for police encounters. 1502 people shot in the last fiscal year and over 700 were white over 300 black over 300 other non whites. If whites and blacks have same amount of police encounters whites are 2x more likely to be shot during an encounter with the police, if the same amount of other non whites are shot as blacks they too are more likely to be shot. See, this is how math actually works. You have to plug in all the information, you cant just leave stuff out. We should not be protesting police brutality against one race, we should be protesting it for all citizens. Protesting anything to increase the quality of life for only your race is true racism. Think about that, and wake up America. May all citizens of this nation come together and fight against all the true oppressers who constantly create division amongst us all. Stop letting the media whether right wing or left wing dictate what you think and believe. This country was in a decent place before the media got so heavily involved in politics, and started voicing their own opinions to the public in an effort to manipulate the young minds of Americans. What a sad time we live in right now in America. 10 years ago the idea of socialism wasn't accepted on any side of the political fence, now we have people trying to push it down our throats. I could care less if it's Democrat or Republican, all politicians are crooks, and for the few that aren't, gone it some time and they will be. But socialism????? Really????? Might as well move to Cuba, Russia, China, Korea, etc..... I know people will respond with those places have communist governments, but know this. Communism starts at socialism. If socialism takes hold, eventually everything will fall under government rule. That means say good bye to the private sector of everything.
Gabrie — September 18, 2018
"unarmed" doesn't mean they don't pose an imminent danger to the police. A scuffle with an "unarmed" civilian could very well end up with a police officer being shot with his own weapon. This article is missing so many variables that it renders it almost invalid.
Phillip D Gossage — September 20, 2018
In some cases it doesn't appear that the stats mentioned in the text match the figures displayed. For example, figure 2 indicates 11 unarmed blacks were killed in 2018 by June. The last sentence in the 3rd para of the text below figure 2 states that "49 blacks were killed by June 2018 that had no gun". Such mismatching stats lead to confusion and a question about the accuracy and credibility of the data.
Also not clarified is the distinction of unarmed blacks killed by police is how many were by white police vs non white police. I suspect a fair number of unarmed blacks are killed by black police distorting the white-on-black race bias portrayed in the media.
maquignon — September 22, 2018
To make any sense you have to compare the number of blacks killed compared to the number of arrests, confrontations or crimes committed, NOT to the percentage of the population!!!! Where the hell did you study logic????
Please Stop Giving Racist White Women Adorable Nicknames - BlackShare — October 17, 2018
[…] people comprise roughly 13 percent of the United States population but make up more than 23 percent of people killed by police. Black men and women have 6.6 to 1 odds of being killed by police while […]
Paul — October 20, 2018
Men are killed at much higher rates than women. Does that mean police are also sexist? If not, why not? Police have been killed or seriously injured by "unarmed" suspects. So there are situations when killing an unarmed suspect is justified as self defense.
Lord Thanatos — October 30, 2018
I think that there are way too many (probably white) people trying to prove this wrong by saying that black people have done things to deserve this disproportionate and discriminatory over policing of minorities found within our American justice system. They wan to ask but what about the crime rate and claim blacks are arrested in their areas because of high crime rates. If they were honest and not trying to push fourth their agenda of racial bias there are other data sets for them to demand as well. If you want to add the amount of crimes committed cool but don't forget to also research the fact that blacks have been found to be falsely accused of crimes 7x more than whites when dna evidence was presented.
You who want to challenge this data in this way but not also include the false accusation data are guilty of trying to push forward a false narrative against African Americans. You only want to demand data on the crime rate but ignore the level of injustice that the same legal system has dished out as if the crime rate statistics from a system that over polices black people in the first place is somehow going to be reliable.
Do a crime rate and false accusation rate test together, and do not just try to use the crime rate to excuse racial discrimination that is rampant in our police system.
Which was the point of the whole article that went over MANY peoples heads from what I'm reading in this comment section. I never thought I'd have to endure the hive mind of stupid that I just witnessed and thanks to them I am sure that I have cancer now. Thanks a lot!
Chris johnson — November 17, 2018
Sure there is racism in the world!but i think alot of this comes from a culture who thinks they are to good to respect police or they shouldnt have to cause there relatives were slaves 150 years ago and its all the white mans fault.but truth be told if they would have never been brought here they would be slaves today! Now we are all seeing the nasty,hateful,anger of ungrateful muslims and the stench of what they call there prophet.I have always had an open mind and accepting of all! That has changed and white and black americans will come together and salt the land of these horrible human beings
Caution: School Zone - Curb: FEARless — November 18, 2018
[…] People of color are far more likely to be stopped by police due to racial stereotyping. In 2015, 26 percent of people killed by police were black, despite black people making up only 13 percent […]
The Power of Youth Organizing & Engagement: Extended Learning Based on the Hate U Give (by Fatmah, Olivia, Holly, and Ericka) | — December 3, 2018
[…] Police Killing of Blacks […]
Anaya King — December 17, 2018
Yeah. Let’s believe a source as credible as the Washington Post as a source. How about the fact that African Americans (who as states DO make up only 13% of the population in America) do 60%+ of the crime in the country. They are also more likely to resist arrest. Police have put activist leaders through simulations to show them how hard of a choice it is. The activists shot the gun at the people more times than the cops did in the simulation. It’s a tough call for police. If a police officer, who wants to get back home to his family too, sees a person and knows that, statistically, they are more like to get hurt by this person, then it is perfectly reasonably for him to be more cautious. That is why COMPLIANCE IS KEY!
Mark — December 19, 2018
I'm a sociologist (a tenured full professor at a major research university), and this just makes me despise my field that much more. The conclusions being drawn here from these descriptive statistics are absolutely absurd. For an intellectually honest analysis of this issue, you'd need to know A LOT more about the circumstances that led up to the shootings. The author, who is a professor at a liberal arts college, might start by educating himself at least a little bit on police use of deadly force--an issue he clearly knows absolutely nothing about. Zilch. This statement really reveals his awful ignorance: "While someone confronted by police without any weapon certainly does not deserve to be killed by police gunfire, I would argue that even those with a weapon other than a gun, should be able to be apprehended by police without the use of lethal force. Police should have the training, skill, and expectation that an encounter, even with a non-cooperative or fleeing citizen, should be resolved by means other than lethal force." No understand of police deadly force at all. Pathetic. No one cares what someone "would argue" when they don't understand the complexities of a topic. Here's my favorite quote from Marcus Aurelius about my own sad field: "The opinion of 10,000 men is of no value if none of them know anything about the subject." Interestingly, 10,000 is about what's left of the declining ASA membership. Stay away students. It's a cult awash in identity politics. It's dying. Get a real job in a useful, honest, meaningful field. Don't waste your time with this gibberish.
Maricica S — December 26, 2018
Whenever theres a police shooting the blacks always try to say the guy was shot soley on the color of his skin. Grand jury and coroners inquests show the facts surrounding the incident show the offender presenting a clear and present danger during a lawful arrest. The black community has staged violent protests on these false assumptions. The Blue Lives Matter organ of the police departments has all their black officers and their families as an alliance to the justice community in the interests of law and order.
Blog #3 – Claimsmaking – Social Idiots Blog — February 3, 2019
[…] Rates of people killed by police organized by race […]
Democratic systems, hearing different stories (1) - Stellenbosch Transparency Stellenbosch Transparency — February 10, 2019
[…] Finally, under the inverted form there is little if any overt police repression. This is because corporate marketing keeps public criticism in check. Therefore the system marginalises persistent oppositional voices. Yet, a militarised police is ready for effective, radical opposition. (The Occupy Movement. Boston suburbs occupation after Marathon bombing. Police shootings of African-Americans). […]
Matthias — February 16, 2019
Wow. Way to lie your way right into the headlines, racist piece of race-baiting shit. You should feel ashamed and disgusted with your race-baiting self, trying to use black folks for your own agenda's progression not to mention the betterment of your own self. Yes, whites are shot and killed in larger totals overall, and then as you attempted to apply your bullshit in the form of mentioning that "whites try to use the fact there are more of them to justify this,". You then, in true leftist trash, hypocritical form, fail to account for the fact that despite representing only 13% of the entire US population, those fine, innocent and harmless black folks as you portray them also account for over 50% of all murderers each and every year not to forget the fact they're also responsible for over 43% of all police officers killed in the line of duty. It stands to reason that if any group, let alone a small minority, commits THAT much and THAT drastically disproportionate amounts of crime, that they will indeed come into not just contact but violent contact far more often than would other demographics you dimwitted fool.
Mike — February 20, 2019
Wow just saw this and people get mislead by the blatant disregard for percentage of crimes committed.. not general population.. if more blacks are committing crimes this stat will be higher.. way to create more civil unrest
Sosyal Bilimler | Kayda Değer Akademik Metinler — March 2, 2019
[…] Beer (March 1, 2018), Police Killing of Blacks: Data for 2015, 2016, 2017, and First Half of 2018, The Society […]
The Inhumane ‘Tradition’ of Lynching – Imperialist Rise and Fall: Empires in Modern Society — June 15, 2019
[…] https://thesocietypages.org/toolbox/police-killing-of-blacks/ […]
San Francisco’s First Black Woman Mayor Raises Hope For Inclusion Across America - Catalyst — July 30, 2019
[…] In both instances, the women’s acts of calling the police escalated the situations. Political commentator Jason Johnson noted that when White residents call the police on Black residents about trivial matters, it is “the epitome of escalation, and calling the police on Black people for non-crimes is a step away from asking for a tax-funded beat down, if not an execution,” given that Black people are much more likely to be killed than White people are in police confrontations. […]
Outlaw Conservative S01E029 - Defeating Racism - Christopher Cantwell — August 7, 2019
[…] the “Black Lives Matter” riots was that blacks are disproportionately represented, as 23% of those killed by police and 34% of those incarcerated in America. From this they conjure a supposed right to smash windows, […]
Outlaw Conservative S01E029 – Defeating Racism – Outlaw Conservative — August 7, 2019
[…] the “Black Lives Matter” riots was that blacks are disproportionately represented, as 23% of those killed by police and 34% of those incarcerated in America. From this they conjure a supposed right to smash windows, […]
Peter C. Sarna — August 8, 2019
What is the raw n and percentage of subjects killed by police, all races and age groups, who complied with police directions? Why isn't compliance and evaluation parameter? This is probably the most discriminating factor in police shootings (dark number is how many times police could have shot and didn't, which is a complex issue).
Douglas L. Jackson — May 29, 2020
How may I obtain photos of the unarmed black men/boys killed by police in the U.S. in the past ten years?
Rudi — May 29, 2020
Show the charges for crime rates in each race and you’ll understand this results no? Lol
Sofia Ferreira — May 30, 2020
Idec what this article says why are you asking if black lives matter? That shouldn't even be a question that's like asking if the life of any human being matter any life matters once you can breath oxygen have thoughts understand your mortality ever one should be given equal rights an equal playing field fucking human decency. All lives matter but right now and for the last 400years black lives haven't so yes the answer to the stupid question in the headline black lives do matter.
Kaman — May 30, 2020
Except none if these numbers came for the DOJ stats. Ergo, false.
karman — May 30, 2020
What this article doesn't address the overwhelming criminals in Chicago are black. That is statistically. a fact. Look at the DOJ stats and you'd get it.
smakki opa — May 31, 2020
Yes, then show stats about Black People killing blacks and whites. Blacks are much more often ready to use a gun against police than whites. These stats you provide don't mean anything until you compare these with this.
Greg — May 31, 2020
I think your statistical data is absolutely wrong look at the actual government statistics and white people shot by police by more than double or at least double of black individuals and that of Hispanic individuals almost tripled. All life is precious, white, black, Asian, Hispanic. Stop reverse racism, work together.
jefft0962 — May 31, 2020
The source of each of the above graphs is the Washington Post - not a legitimate source. Try again, but use the FBI / DOJ official crime statistics.
That aside, there is no baseline, which should be enough to demonstrate that this data is severely flawed. This was most likely an intentional omossion to "prove" a pre-conceived perspective.
Sad, that you saw fit to publish such obviously incorrect data as "facts".
Richie rich — May 31, 2020
Ok I am a white man that has been victim 2 times to police and people of authority ie jail staff. What the problem is when you don’t follow their precise commands and they happen to be having a bad day some will try to use the badge or their authority to take it out on others. I don’t doubt race plays a role in some encounters and it’s sad. Police are here to protect and serve not order or to fine citizens for things they could just get a warning for like passing a fake bill or speeding both things can be unintentional or if it’s some law I don’t know about like a damn noise ordinance shit. Really police need worry about real crime a fake 20 is no real crime now if he had stacks of fake 20s that’s a different story still no reason to treat him that way. Bad things happen in this world it’s sad. Doesn’t mean do more bad things like loot and shoot and set fires that is just ignorant people at the end of the day your just defacing your world and hurting more people regardless of color all lives matter!!!!! When people including police realize that life is precious stop playing treat everyone as you would want be treated thanks for reading have a nice morning day and night.
Richie rich — May 31, 2020
I was tased by a cop just because I cussed him out that’s bullshit then down south I was bear maced with three cans of mace I mean the large cans for nearly whole body was on fire and they hog tied me and I pissed myself because they wouldn’t untie me and pick me off the floor too pee it was 4 hours of that. They did all this just cause I called em turnkeys and I know my rights you can’t touch me if I’m restrained and not being violent I was wrong they can do whatever the fuck they want in them hillbilly jails smh
Seems About White – Brennan Babbles — June 1, 2020
[…] the majority of police shooting victims were white, black shooting victims were by far the most disproportionately represented. This isn’t some problem that Donald Trump created. He, in his trollish Tweets, is simply the […]
Max — June 1, 2020
The title of this article says "POLICE KILLING OF BLACKS: Do Black Lives Matter?" Well sometime I wonder if it really does matter to the black leadership in this country. The latest statistics show that the Black on Black murder rate is 10x higher than the murders rate committed by the Police towards Blacks and almost 3x higher than White on White murders as compared based on population. This doesn't in anyway excuse the violence and the excessive use of force used by some police departments today. But, Black on Black violence is a huge problem in this country and one Black leadership refuses to address seriously because it requires hard work and real solutions and not just catchy slogans for the masses.
Systemic Racism | J. Matthew Barnes — June 2, 2020
[…] unfortunately, the data shows that a given black person is much more likely to die at the hand of the police than a… All of the factors above play into this sad […]
Mark — June 2, 2020
Your article "POLICE KILLING OF BLACKS: Do Black Lives Matter?" is poorly researched and doesn't include all of the facts. Anyone with common sense can easily refute it. How about the fact that cops are 18.5% more likely to be killed by a black perpetrator than an unarmed black perp is to be killed by a cop? https://www.manhattan-institute.org/html/deadly-shootings-ignored
Felix stewart — June 4, 2020
All lives matter!! Even those wemen being forced to apologize for being white!!!
Felix stewart — June 4, 2020
The wemen in l.a.being forced by black lives matter need th o realize there lives also matter &there rights r being violated
Felix stewart — June 4, 2020
If l.a. would just start there economy again they'd b able to pay there police again.
Felix stewart — June 4, 2020
If a white guy is killed by a black cop it wouldn't even m as ke the news
Chris — June 5, 2020
While I (like many) have been outrages by overt police brutality and excessive use of force (as posted by many videos). I have several issues with this article and the "facts" presentee, which are based on statistics.
Yes, a disproportionate number of black people are killed by police (as your numbers reflect). However, a secondary statistic is ignored, which is the percentage of crimes committed by race. When crime statistics are reviewed, you will find that the percentage of individuals killed by police is relative (by race) to the percentages involved in crimes (especially the more violent and aggressive forms of crime). So, while the black population may be currently 12%, the current statistics show that Black or African American perpetrators represent approximately 27% of the total crime being committed (percentage is larger when white collar crime is excluded).
Obviously, the likelihood of coming in contact with the police increases during the commission of a crime and this more Black/Africa America citizens are in contact with police based on th crime statistics.
Please understand that I do not side with the police nor do I believe that they have acted appropriately at all (especially in the current situation with George Floyd arrest). However, even in this scenario, it was initiated during the commission of a crime.
There are a large number of things that need to be improved throughout society but we will never get past/beyond racism until we stop making everything about race. George Floyd was a man who was unfairly killed by a police officer. His or the officers race should not be relevant. The fact that he deserved to not be killed is what is truly relevant. It is thoroughly sad to me that when I read news reports, it only focuses on race and only when doing so increases the level of sensationalization and civil anger.
Go read about cases where a white victim is murdered/assaulted by a black assailant and show me where they make a point of identifying the race of the victim/perpetrator. It doesn't happen...why? Because it is not relevant and many would claim it is racist to do so. The same standards need to be held for all people.
Sociology professor — June 6, 2020
As a person with a Ph.D. in sociology and who has taught this subject for a number of years, I an say that this article is biased in its use of statistics and articles. True that blacks are over-represented as victims of police shootings--but WHY? Racism is one possible answer, but is not well supported by the evidence. Howe many blacks are killed by black officers? How many are justified shootings because of a direct threat? Take out those numbers and blacks are actually under-represented as victims of police shootings. Consider also that police patrol more in high density poor areas--which are more often occupied by blacks. That means that there is more contact between officers and blacks. Finally, there are credible studies on how blacks versus whites respond to contact with officers. Blacks more often escalate contact than whites, which leads to more violent encounters.
John T — June 6, 2020
This article is highly flawed. Mass murders are committed more by whites, so that is more killings by fewer people. Also, the number of violent crimes by blacks is a multiple of those by whites - if anything, cops are MORE likely to shoot a white because they know there will be no riot. There is no comparison in terms of violent crime, though Antifa if trying to level that statistic.
Jim — June 6, 2020
Yes all lives matter if only BlM then you a racist all you have to do what the officers ask you to do get out of the car what's is so hard about that. DA...Do what's right this will be a better country GOD bless America
Ted — June 8, 2020
Using population numbers as a statistical comparator for the race of people killed by police is a complete absurd and an inaccurate and irrational statistical measure.
This would be like trying to claim that motorcycles are more dangerous for White men than Black men because White men account for 90% of people killed driving motorcycles in the U.S., but they only account for 30% of the U.S. population or conversely trying to claim that motorcycles are safer for Black men because Black men only account for 2% of motorcycle deaths yet they account for 12% of the U.S. population. This would be absurd and a completely inaccurate statement which simply cannot be supported by using population percentage by race and percentages of people who ride motorcycles by race.
The reality is that White men are much more likely to drive motorcycles than Black Men, so White men are also much more likely do die on a motorcycle than Black men. Population percentage is irrelevant. If White men make up 90% of people who drive motorcycles and they also make up 90% of people killed on motorcycles, than the fact is that motorcycles are not more dangerous for White men, irregardless if White men only account for 30% of the population. More white men drive motorcycles so more white men die on motorcycle. There is no statistically anomaly or inequality proving motorcycles are more dangerous for White men.
The same can be said regarding police use of force against African American men, The harsh reality is that in the U.S. black men account for 40% of violent crimes and 50% of murders, and also 33% of police officers who are murdered in the line of duty are killed by black men, yet black men only account for 6.6% of the U.S. population. Also black men account for 23% of people killed by police. In other words, black men are 6 times more likely to commit a violent crime, 7.5 times more likely to commit murder, and 5 times more likely to kill a police officer, but they are only 3.7 times more likely to be killed by a police officer. Their percentage of the population is really irrelevant.
The harsh reality is African American men commit a higher percentage of murders, violent crimes, crimes while armed with a deadly weapon, assaults on police officers, assaults on police officers with a deadly weapon, and murder of police officers than the percentage of African American men in the population.
When considering whether African American men are killed by police at a higher rate than white men and other races, the proper statically measure would be to look at the rate at which African American men commit these violent crimes in comparison to the rate that African American men are killed by police and no matter which measures we look at, the numbers show that African American men are not unjustly killed at a higher rate than they the rate at which they commit these violent crimes, including the murder of police officers. Using population percentages to try to support this claim is completely disingenuous and not accurate.
Jonathan Barrow — June 9, 2020
The supposition underpinning the conclusions is that 'race is a social construct'. The discussion is in modern orthodoxy taboo, but as far as I can see from the hard science of Biology (medicine, genetics) that supposition is not true. Without seeking truth, we will go round in vicious circles trying to find fake 'solutions' to problems.
James — June 9, 2020
he is correct it is hard to find data on police interactions by race but there is data on the 10 million arrests per year. If you assume that the 1000 people killed a year by police were going to be arrested then you could look at chance of being killed by police during arrest. That is reasonable because surely they would arrest the person if they are using force. You then have a 0.0089 percent chance of being killed by a police officer if you are white/hispanic during an arrest but you only have a 0.0078 percent chance of being killed by a police officer if you are black during an arrest. I think black people are more upset and believe they have higher rates of being killed by police because they do interact with police more often as the author clearly shows in his article.
Lone ranger — June 10, 2020
Questions:
1-i agree with above that using percentages is misleading. what is the actual number of unarmed black people (male and female) that were killed in 2019 by police officers? Is 10 correct?
2-how many of those were in the process of a criminal act?
3-how many police officers were killed by black men/women over same period. i believe it is 18 times more...(that of course is killed by 14% of the population) as you state above.
4-how many black people (men and women) were killed by black people in 2019 i belive that number is well over 7,000.
I also received my data from washington post and wall street journal articles. I am curious if 10 killing in 2019 is accurate. This information may be required to give a truthful and more accurate assessment of where the problem lies. Perhaps not as much with police as with social issues. Black lives must matter as much to black people as they do to all ethnicities.
Thomas G Clouse — June 11, 2020
How about getting some to statistics on the blacks that are unemployed and collected on the system compared to the white the yellows and the Browns.. in the majority of the big cities the blacks outnumber every race so of course there's going to be more getting shot and killed want you going out to some of these little country towns and find out how many blacks and whites are shot there are equal numbers actually the whites are shot more than the blacks banana God damn one of them crying racism .
Paul Carvey — June 11, 2020
Everyone argues that certain races are disproportionately killed by police. The denominator is always the racial makeup in the country. This is truly misleading. In Chicago and most major metropolitan areas, the percentage of races doe not match the national makeup. So 31% of Chicago is black, not 13%. Since the vast majority of police shootings occur in metropolitan areas that should be the denominator. When you look at the data in this light, the race-related shootings by police are significantly closer to racial make-up of the city.
Systemic Race Baiting — June 11, 2020
A large combined leftist collective is conducting a propaganda war and a political war. A combination of a large National Leftist Media, hollywood, a large Tech Left, leftists CEOs, etc. all UN-elected people. It is called "March Through The Institutions" you can look it up. There are 10 large leftist media outlets for every 1 on the right (Attkisson media bias chart). I mean, CNN PAYS to broadcast in all major airports. If the left wants to conduct a political war, then a war they will get. By the end of the year there will be 10 more media outlets or well-known blogs on the right IN RESPONSE. The far left in the country DOES NOT SELF-REGULATE yet they preach that every one else should be self-regulating.
Here is a quick example of the word manipulation used daily by the leftist media: "police involved killings of black people" - I mean wow quote "involved" - the daily word manipulation, re-writing the dictionary. It is a language manipulation tool to remain abstract only when it benefits the narrative, and in contrast later be specific but only if it benefits the narrative, using a zoom-in/zoom-out selectively to manipulate public perception. Watch for this tactic, you will see this DAILY from the leftist media. And IN RESPONSE those on the right are starting this as well. POLARIZATION.
Even the title of THIS article is quote "Police Killing of Blacks" and the pivotal propaganda tactic is just two words: "Police Killing" - it is an attempt to plant those two words in the minds of as many people as possible, for political power reasons.
Quote "All things equal, a socially-constructed racial group should be subject to lethal encounters with the police at a similar rate to their proportion in the population." Wow "all things equal" - how telling. Show me the charts where demographic groups LISTEN equally, stay in SCHOOL equally, behave equally, parent equally etc. Show me the chart indicating demographics where parents "equally" avoid passing-down race-baiting tactics to their children daily. NONE of these very important influences are exposed in this article. Leftists will never focus on PERSONAL responsibility (unless it is to point the finger at others).
I KNOW what the root of all this is, and I could go on, but my post here is already lengthy. In a nutshell, it is a spiritual problem, no matter the race.
The polarization will continue. Word manipulation for political reasons. According to the Bureau of Justice Statistics from 2011, averaged with other years, if there are 40 million interactions per year with police, with 1000 shot/killed by police per year, then the police fatally shot a citizen in approx. 0.003 percent of those interactions. In other words 99.997% of the time the police DID NOT fatally shoot anyone during an interaction.
This website is not winning anyone over. The leftist media is causing serious, deep polarization. So, don't be surprised that's what you end up with. A large collective leftist media in the country decided 5 years ago to completely sacrifice their fragile claim/reputation of being "neutral" in order to influence an election. It will take 100 years to recover. Way to go. They are political activists NOT JOURNALISTS.
FYI I am an Independent. I am a scientist. I am NOT a "trump supporter."
Jack — June 14, 2020
This is a total Phony "study" which deliberately ignores the FACT that black males make up only about 6.5% of the US population and yet commit over 50% of all murders, ~30% of aggravated assaults, 54% of robberies and 28% of rapes!
https://ucr.fbi.gov/crime-in-the-u.s/2017/crime-in-the-u.s.-2017/tables/table-43
http://livepopulationof.com/us-population-by-race/
Tony — June 14, 2020
Let's tell the other side of the story.
According to the annual FBI, crime stats 53% of all homicides and 60% of all violent crimes are committed by Black Americans even though Black Americans make up only 13% of the US population.
Cops are killed 18.5 times more by Blacks then cops killing Blacks for any reason.
Please stop being disingenuous!
JB — June 16, 2020
Nice comments by Chris, Ted and some others! This whole BLM is a huge pile of BS. ALL LIVES MATTER! Where are the BLACK LIVES MATTER protests and riots for the 94% of black murder victims who just happened to be murdered by their fellow black man or woman from 1976 through 2005. Or the 88% of the same for 2018, blacks murdered by blacks? Where is the outrage from the black community over these factual numbers? Where are the protests? Where are the riots?
Oh by the way, has anyone noticed who is doing all the looting during these “peaceful” protests, oops, I mean riots? You got it!
There is no need to discuss or mention more numbers or percentages as they were very well layed out by Chris & Ted. The author of this article should be ashamed of itself.
Instead of trying to find out why blacks are allegedly discriminated against by the police more than other races, maybe Leaders in the Black Communities should try to get their people to stop committing crimes at such a high rate or learning respect for other people’s person and property and possibly more importantly, teach your black communities the words & definitions of the words, EMPLOYMENT (in lieu of welfare), RESPECT (in lieu of disrespect) & EDUCATION (in lieu of crime & gang activity)!
Maybe they should also be taught that complying with the directions of authority figures is a good way for their black life to matter!
I’m white! If I get stopped or detained by the police, I’m smart enough to know that any disrespect or non-compliance shown to the officer/officers involved is not going to end well for me!
If you get detained by the police and you decide to become confrontational for whatever reason, your black life isn’t going to matter as much compared to how much your black life would matter if you were being compliant and respectful toward the police officer who caught your crime committing selves.
Wake up people! Maybe if Black People cared more about Black People ALL OF THE TIME, Black Lives would Matter to everyone else!
Donald Bohlken — June 19, 2020
What is going on with the Washington Post statistics on police fatal shootings? This article, dated May 26, 2020, indicates "Counts rather than percentages show that in 2019, 9 blacks, 19 whites, and 6 Hispanics were unarmed when killed by police." A June 4, 2020 Tucker Carlson essay indicated, "Overall, there were a total of precisely ten cases in America, according to the Post, in which unarmed black Americans were fatally shot by police." A June 8, 2020 CNS News article indicated, "In 2019, 15 unarmed black people were shot and killed by on-duty police officers, compared with 25 whites." That is the number the Washington Post database indicates today, June 19, 2020.
Not only that, but Tucker Carlson's deep dive into the actual facts on the ten "unarmed" blacks that were shot dead by police shows that five were actually armed; two with guns; two with cars: and one with a taser. The cars and taser were actually used to assault police officers. In the two cases where the decedents had guns, the officers were charged with homicide.
So it appears that the actual number of "unarmed" blacks shot dead by police may be one-half of that claimed by the Washington Post statistics, i.e. seven or eight versus the claimed sixteen. While even one unjustified shooting is one too many, the tiny number of unarmed blacks actually shot dead by police proves that Senator Cory Booker was in error when he said, "We have so many people in our country, African-American men, mostly unarmed, being murdered by police officers and no way of holding them accountable.”
Real Police/Crime Stats – The Urban Conglomerate Magazine — June 25, 2020
[…] https://thesocietypages.org/toolbox/police-killing-of-blacks/ […]
Donald Bohlken — July 1, 2020
The Des Moines Register published my article, "What do the statistics, not the stereotypes, about killings by the police tell us?" https://www.desmoinesregister.com/story/opinion/columnists/iowa-view/2020/06/29/police-and-racism-what-statistics-show-stereotypes/3274391001/
People interested in this issue might give it a view.
Richard W Fahlbusch — July 2, 2020
The only way to stop this B...S... is if the person being stopped by police whether black, white, or whatever ethnic group would STOP RESISTING AND STOP RUNNING AWAY....
USA Protest | George Floyd Protest | Black Lives Matter | Full explanation in Hindi | NEWS5 — July 30, 2020
[…] sources for more reading: https://thesocietypages.org/toolbox/police-killing-of-blacks/ […]
Dale — August 9, 2020
As stated many times already, this author has been intellectually dishonest, either failing to present relevant data or manipulating it to arrive at his preconceived result.
We can all agree there are bad apples in every profession and this is true for law enforcement. Bad apples are not the majority in the basket but must be removed to keep the rest from spoiling.
The slogan Black Lives Matter of itself is racist as it implies they are more important than other lives. That's bad enough. When you actually read their mission statement you will see they are more about destrowing the nuclear family and civil way of life than they are about helping the black community. When you follow the money, it gets even worse. They've raised $7 billion over 7 years and not one penny has gone to hepping a black community, not to a single food bank, not to help a single black business or support black children. What hasn't been spent on salaries, busses, marketing or administration has 100% gone to federal level democratic political campaigns with the majority of those being white politicians.
BLM is a dog whistle for the uninformed, especially dumb spoiled white youth and young educators (I use the term "educators", loosely). BLM is a Marxist political cash machine that could care less about improving black lives. The proof is there, all you have to do is look at it.
The reporter who wrote this bullshit article knows it and doesn't care either.
Barry Guthrie — August 27, 2020
not one black livfe matters to me they are a racist hate group, and google face book bows to these white black scum in my belief
Racial Hypocrisy | Lew Bornmann's Blog — August 31, 2020
[…] Beer, Todd. Police Killing Of Blacks: Do Black Lives Matter?, Sociology Toolbox, https://thesocietypages.org/toolbox/police-killing-of-blacks/, 26 May […]
Random Life — September 15, 2020
They all deserved it, well mostly. Sick and tired of you western privileged afromuricans thinking you are above the law.
Op-Ed: Free the Vaccine, Free the People – The Center for Artistic Activism — December 25, 2020
[…] killing Black people, who comprise only thirteen percent of the U.S. population, but roughly twenty-seven percent of the country’s deaths by police violence, and twenty-five percent of the country’s deaths related to coronavirus. These pandemics are […]
RHD Response to Racism | Resources for Human Development | — March 30, 2021
[…] Data and studies on police brutality: https://thesocietypages.org/toolbox/police-killing-of-blacks/ […]
San Francisco’s First Black Woman Mayor Raises Hope For Inclusion Across America (Blog) | Catalyst — June 17, 2021
[…] In both instances, the women’s acts of calling the police escalated the situations. Political commentator Jason Johnson noted that when White residents call the police on Black residents about trivial matters, it is “the epitome of escalation, and calling the police on Black people for non-crimes is a step away from asking for a tax-funded beat down, if not an execution,” given that Black people are much more likely to be killed than White people are in police confrontations. […]
Black Lives Matter berör även Svenskfinland – Allt AB. — May 11, 2023
[…] bara under 2019. Av dem som skjutits ihjäl av poliser mellan 2015-2019 visar statistiken att en disproportionerligt stor andel var afroamerikaner – 26.4% – jämfört med att deras andel utgör 12% av hela […]
Black Lives Matter-liike koskettaa myös sinua – Allt AB. — May 11, 2023
[…] vuonna 2019. Tilastot osoittavat, että niistä, jotka poliisi ampui vuosina 2015-2019, suhteettoman suuri osuus on afroamerikkalaisia – 26,4% – verrattuna 12%:iin koko väestöstä. Käytännössä […]
Black Adolescent Male Violence ~ Confronting the devastating... — September 14, 2023
[…] Beer, T. (2018). Police Killings of Blacks: Data for 2015, 2016, 2017, and the first half of 2018. The Society Pages. […]