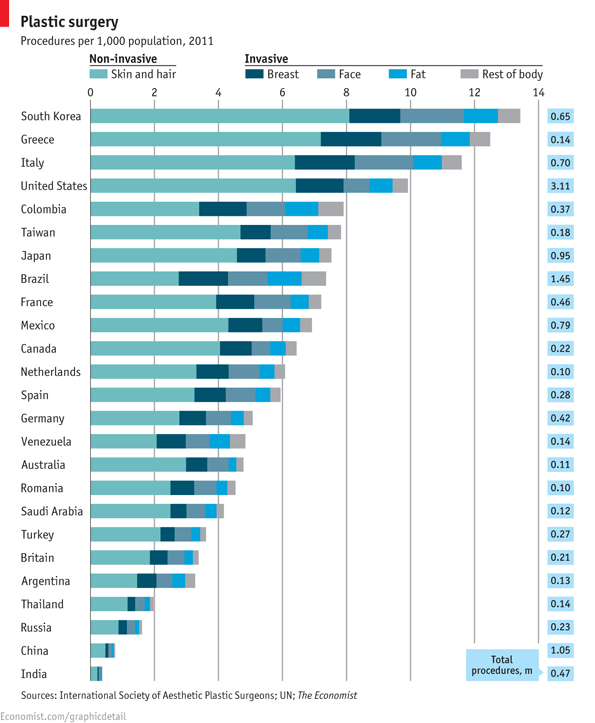
The International Society of Aesthetic Plastic Surgeons has released new data on the incidence of invasive and non-invasive cosmetic procedures. The U.S. leads in sheer numbers of procedures but, accounting for population, we fall into 4th place. South Korea leads for the number of procedures per person, followed by Greece and Italy.
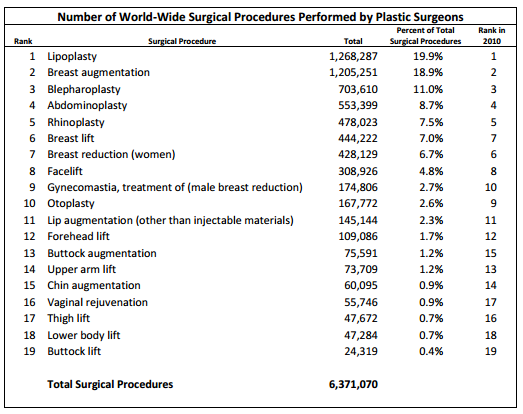
By far the most common kinds of surgical cosmetic procedures are lipoplasty and breast augmentation. Along with fat, breasts seem to be a particular concern: breast lifts and breast reductions for both men and women are also in the top ten. Abdominoplasty, nose jobs, eyelid surgeries, and facelifts are as well.
The incidence of these surgeries is strongly related to everything from the gender binary to global power dynamics. In 2008 we reported that male breast reductions were the most common cosmetic surgery for 13-19 year olds (boys and girls combined). You would be shocked at what counts as excess breast tissue and how little the before and after photos look. Boys and men getting breast reductions, alongside women getting augmentations, is obviously about our desire for men and women to be different, not naturally-occurring difference. See The Story of My Man-Boobs for more.
Likewise, we’ve posted about surgeries that create an epithelial fold, a fold of skin in the eyelid more common in people with White than Asian ethnic backgrounds. This surgery is a trend among Asians and Asian-Americans, as colonization has left us with an association between Whiteness, attractiveness, and power.
The Economist summarizes some other trends:
Breast augmentation, the second biggest surgical procedure, is most commonly performed in America and Brazil. Buttock implants are also a Brazilian specialty, as is vaginal rejuvenation. Asia is keen on nose jobs: China, Japan and South Korea are among the top five nations for rhinoplasty.
More on where and how many procedures are being performed, but nothing on why, at the ISAPS report.
Image at The Economist; via Global Sociology.
Lisa Wade, PhD is an Associate Professor at Tulane University. She is the author of American Hookup, a book about college sexual culture; a textbook about gender; and a forthcoming introductory text: Terrible Magnificent Sociology. You can follow her on Twitter and Instagram.