nation: South Korea

Cross-posted at Neuroskeptic.

“Personality differences” between people from different countries may just be a reflection of cultural differences in the use of “extreme” language to describe people.

That’s according to a very important paper just out from an international team led by Estonia’s René Mõttus.

There’s a write up of the study here. In a nutshell, they took 3,000 people from 22 places and asked them to rate the personality of 30 fictional people based on brief descriptions (which were the same, but translated into the local language). Ratings were on a 1 to 5 scale.

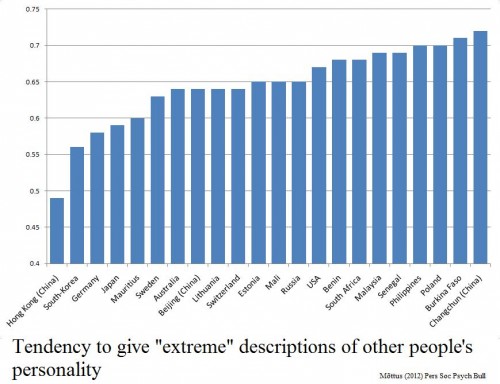
It turned out that some populations handed out more of the extreme 1 or 5 responses. Hong Kong, South Korea and Germany tended to give middle of the road 2, 3 and 4 ratings, while Poland, Burkina Faso and people from Changchun in China were much more fond of 1s and 5s.

The characters they were rating were the same in all cases, remember.

Crucially, when the participants rated themselves on the same personality traits, they tended to follow the same pattern. Koreans rated themselves to have more moderate personality traits, compared to Burkinabés who described themselves in stronger tones.

Whether this is a cultural difference or a linguistic one is perhaps debatable; it might be a sign that it is not easy to translate English-language personality words into certain languages without changing how ‘strong’ they sound. However, either way, it’s a serious problem for psychologists interested in cross-cultural studies.

I’ve long suspected that something like this might lie behind the very large differences in reported rates of mental illness across countries. Studies have found that about 3 times as many people in the USA report symptoms of mental illness compared to people in Spain, yet the suicide rate is almost the same, which is odd because mental illness is strongly associated with suicide.

One explanation would be that some cultures are more likely to report ‘higher than normal’ levels of distress, anxiety — a bit like how some make more extreme judgements of personality.

So it would be very interesting to check this by comparing the results of this paper to the international mental illness studies. Unfortunately, the countries sampled don’t overlap enough to do this yet (as far as I can see).

Source: Mõttus R, et al (2012). The Effect of Response Style on Self-Reported Conscientiousness Across 20 Countries. Personality and Social Psychology Bulletin PMID: 22745332

————————

Neuroskeptic blogs anonymously here.  You can also follow him on Twitter.

Cross-posted at Reports from the Economic Front.

The Pew Research Center recently published a report titled “Pervasive Gloom About the World Economy.” The following two charts come from Chapter 4 which is called “The Causalities: Faith in Hard Work and Capitalism.”

The first suggests that the belief that hard work pays off remains strong in only a few countries: Pakistan (81%), the U.S. (77%), Tunisia (73%), Brazil (69%), India (67%) and Mexico (65%). The low scores in China, Germany, and Japan are worth noting. This is not to say that people everywhere are not working hard, just that many no longer believe there is a strong connection between their effort and outcome.

The second chart highlights the fact that growing numbers of people are losing faith in free market capitalism.  Despite mainstream claims that “there is no alternative,” a high percentage of people in many countries do not believe that the free market system makes people better off.

GlobeScan polled more than 12,000 adults across 23 countries about their attitudes towards economic inequality and, as the chart below reveals, the results were remarkably similar to those highlighted above.  In fact, as GlobeScan noted, “In 12 countries over 50% of people said they did not believe that the rich deserved their wealth.

It certainly seems that large numbers of people in many different countries are open to new ways of organizing economic activity.

Martin Hart-Landsberg is a professor of economics at Lewis and Clark College. You can follow him at Reports from the Economic Front.

Cross-posted at Reports from the Economic Front.

The Supreme Court has ruled favorably on the legality of the Affordable Care Act.  Actually, despite its name, the Act has more to do with extending and attempting to improve private health insurance coverage than it does with improving care or reducing its cost.

Unfortunately for us, the effort to improve our health care system has remained within bounds set by the needs of private health care providers and insurers.  As President Obama made clear from the start of his push for health care reform, there would be no consideration of a universal system.

Critics of such a universal system are always quick to argue that only market forces driven by the private pursuit of profit can ensure an efficient health care system.  Of course, in determining whether this is true, we need to recognize that efficiency is a complex term and that our health care system, like all systems, produces multiple outcomes.  The most obvious ones are private profit as well as the quality and cost of the relevant health care.

In terms of private profit there can be no doubt that our health care system functions well.  However, the story is quite different if we evaluate it in terms of quality and cost.  The fact that we continue to embrace a private health care system makes clear which measures of efficiency are considered most important and by whom.

The following map shows the countries, colored green, that have adopted a universal health care system.

mf-healthcaremap-p-thumb-615x314-91612.jpg

As Max Fisher explains:

What’s astonishing is how cleanly the green and grey separate the developed nations from the developing, almost categorically. Nearly the entire developed world is colored, from Europe to the Asian powerhouses to South America’s southern cone to the Anglophone states of Australia, New Zealand, and Canada. The only developed outliers are a few still-troubled Balkan states, the Soviet-style autocracy of Belarus, and the U.S. of A., the richest nation in the world.

The handful of developing countries that provide universal access to health care include oil-rich Saudi Arabia and Oman, Latin success story Costa Rica, Kyrgyzstan, and, famously, Cuba, among a few others. A number of countries have attempted universal health care but failed, such as South Africa, which maintains a notoriously inefficient and troubled public plan to complement the private plans popular among middle- and upper-class citizens…

That brings us to another way that America is a big outlier on health care. The grey countries on this map tend to spend significantly less per capita on health care than do the green countries — except for the U.S., where the government spends way more on health care per person than do most countries with free, universal health care. This is also true of health care costs as a share of national GDP — in other words, how much of a country’s money goes into health care.

The OECD just published a major study on the health care systems of its 34 member nations.  It found that:

 Health spending accounted for 17.6% of GDP in the United States in 2010, down slightly from 2009 (17.7%) and by far the highest share in the OECD, and a full eight percentage points higher than the OECD average of 9.5%. Following the United States were the Netherlands (at 12.0% of GDP), and France and Germany (both at 11.6% of GDP).

The United States spent 8,233 USD on health per capita in 2010, two-and-a-half times more than the OECD average of 3,268 USD (adjusted for purchasing power parity). Following the United States were Norway and Switzerland which spent over 5,250 USD per capita. Americans spent more than twice as much as relatively rich European countries such as France, Sweden and the United Kingdom.

combined1.jpg
What does all of this mean in terms of health outcomes?  According to the OECD report:

Most OECD countries have enjoyed large gains in life expectancy over the past decades. In the United States, life expectancy at birth increased by almost 9 years between 1960 and 2010, but this is less than the increase of over 15 years in Japan and over 11 years on average in OECD countries. As a result, while life expectancy in the United States used to be 1½ year above the OECD average in 1960, it is now, at 78.7 years in 2010, more than one year below the average of 79.8 years. Japan, Switzerland, Italy and Spain are the OECD countries with the highest life expectancy, exceeding 82 years.

One possible explanation for this lagging performance, highlighted in an earlier OECD report, is that the U.S. ranked 26th in terms of the number of practicing physicians relative to its population, 29th in terms of the number of doctor consultations per capita, 29th in terms of the number of hospital beds per capita, and 29th in terms of the average length of hospital stay.  At the same time, the “U.S. health system does do a lot of interventions… it has a lot of expensive diagnostic equipment, which it uses a lot. And it does a lot of elective surgery — the sort of activities where it is not always clear cut about whether a particular intervention is necessary or not.”

Private health care providers and insurers are clear about how they measure health care efficiency.  And as long as we rely on them to set the terms of the debate we will continue to suffer the consequences.

In an interesting example of cultural borrowing/appropriation sent in by Catherine H., the Korean all-girl pop band T-ara imitates stereotypes of American Indians in their music video for their (strangely catchy) song, YaYaYa.

It’s difficult (for me) to know how these stereotypes of native North Americans “work” in Korea. It appears to mean something to Koreans, otherwise why use the imagery and narratives, but what? And how should Americans who oppose the stereotyping (and erasing of modern) Native Americans talk about this “borrowing”?

To get some perspective, I turned to James Turnbull.  Turnbull is behind the blog, The Grand Narrative, where he writes about Korean Sociology through the prism of pop culture.  This is what he had to say:

First, please note that T-Ara’s Yayaya is actually just one of several recent Korean music videos that have used Native-American imagery, and by no means the most offensive at that. For a list, see here, which points out that Indian Boy by MC Mong is much more problematic.

Second, so many Korean groups are being formed these days – over 30 new girl-groups in 2011 alone – that their management companies (most well-known Korean groups are completely “manufactured”) are in a constant battle to gain media attention for them. One way to do so is to regularly come up with new “concepts” for the group, of which a “cute” one incorporating Native-American imagery is just one possibility of many.

But thirdly and most importantly, it is no exaggeration to say that Korea is one of the least politically-correct societies out there, particularly in the ways in which non-Koreans are represented in popular-culture.

Often, this is completely innocent, most Koreans being ignorant of the connotations of Blackface for instance, or the passions Nazi imagery arouses in Western countries, to the extent that both are regularly found in popular culture and advertising. Indeed, I was especially struck once by reading of university students performing in Blackface at a festival because they thought Black audiences would like it, and would appreciate the interest in “their culture”. As the person who saw this wrote, this was not “offensive” per se, but it was certainly shocking.

Alternatively however, the ignorance can be willing. For example, last year the the Korean Overseas Information Service (KOIS) part of the Ministry of Culture, Sports and Tourism, produced an expensive “Visit Korea” ad which played on the likes of CNN and BBC World and so on, but which relied so heavily on patronizing stereotypes of non-Koreans that it would likely have put off more potential tourists than attracted them. Non-Koreans in the KOIS were consulted in the making however, and did warn the producers of this, but unfortunately their advice was rejected, either because a) Korean advertisers are notorious for producing things that would appeal primarily to Koreans, despite the actual target audience, and/or b) it didn’t jibe with the advertisers’ perceptions of non-Koreans and their wants or needs. (Both are persistent problems with Korean tourism advertisements.)

Finally, for the source of those perceptions, consider Korea’s extremely exclusionary “bloodline”-based nationalism andextremely homogenous population (less than 3% of Korea’s population are “foreign residents”, a third of which are ethnic Koreans from China). Consequently, Korean society is really only just beginning to grapple with the concept of multiculturalism, albeit with much urgency because of the sudden huge influx of brides from Southeast Asia in the last decade or so, with the populations of many rural communities close to becoming a third or even half non-ethnic Korean. Certainly, a great deal of progress has been made in integrating them and acknowledging what their cultures have to offer, but when Korean school textbooks extolled the virtues of being an ethnically homogenous society until as recently as 2006 (and see here for how Blacks and native-Americans were portrayed in school picture dictionaries at that time), then I’m sure you can appreciate that much still remains to be done to prevent prejudice against them, especially in how non-Koreans and cultures are portrayed in the media.

Which to be fair, nobody outside of Korea was at all concerned with until K-pop became popular!

Thank you, James!

We’re happy to hear your thoughts in the comment threads. The video:

Lisa Wade, PhD is an Associate Professor at Tulane University. She is the author of American Hookup, a book about college sexual culture; a textbook about gender; and a forthcoming introductory text: Terrible Magnificent Sociology. You can follow her on Twitter and Instagram.

How does the U.S. compare to other developed countries on measures of social justice? According to the New York Times, not very well.  The visual below compares countries’ poverty rates, poverty prevention measures, income inequality, spending on pre-primary education, and citizen health.  The “overall” rating is on the far left and the U.S. ranks 27th out of 31.


Via Feministing.  See also how the U.S. ranks on measures of equality and prosperity(33 out of 33, for what it’s worth). Thanks to Dolores R. for the link!

Lisa Wade, PhD is an Associate Professor at Tulane University. She is the author of American Hookup, a book about college sexual culture; a textbook about gender; and a forthcoming introductory text: Terrible Magnificent Sociology. You can follow her on Twitter and Instagram.

Dmitriy T.M. sent in a New York Times slideshow of the contents of “MREs” from different countries.   MREs stands for “Meals Ready to Eat”; they are combat rations for soldiers. The rations are each some combination of comfort food, nutrition, and necessity.  And the different contents across countries reveal some interesting similarities and differences.

All MREs include some sort of meat, but the type and form of the meat vary, from meatballs to paté.  Meanwhile, almost all of the MREs include candy; it’s probably cheap, in the big scheme of things, to throw a few skittles, m&ms, or squares of chocolate, but what a treat it must be.  Likewise, the fruit-flavored beverages and tea must be a taste of home.  As for practicality, countries vary in whether they provide moist towelettes, toothpicks, tooth brushes.   Most offer matches; the U.S. includes toilet paper.

That said, the content of rations are also strikingly consistent.  I’ve love to see a flow chart tracing the development of MREs.  Were the logics for these rations developed in isolation?  Or were some countries influential over others?

These are my uneducated observations.  Feel free to offer more informed thoughts in the comments.

Lisa Wade, PhD is an Associate Professor at Tulane University. She is the author of American Hookup, a book about college sexual culture; a textbook about gender; and a forthcoming introductory text: Terrible Magnificent Sociology. You can follow her on Twitter and Instagram.

Cross-posted at Family Inequality.

I have criticized sloppy statistical work by some international feminist organizations, so I’m glad to have a chance to point out a useful new report and website.

The Progress of the World’s Women is from the United Nations Entity for Gender Equality and the Empowerment of Women. The full-blown site has an executive summary, a long report, and a statistics index page with a download of the complete spreadsheet. I selected a few of the interesting graphics.

Skewed sex ratios (which I’ve written about here and here) are in the news, with the publication of Unnatural Selection, by Mara Hvistendahl. The report shows some of the countries with the most skewed sex ratios, reflecting the practice of parents aborting female fetuses (Vietnam and Taiwan should  be in there, too). With the exception of Korea, they’ve all gotten more skewed since the 1990s, when ultrasounds became more widely available, allowing parents to find out the sex of the fetus early in the pregnancy.

The most egregious inequality between women of the world is probably in maternal mortality. This chart shows, for example, that the chance of a woman dying during pregnancy or birth is about 100- 39-times higher in Africa than Europe. The chart also shows how many of those deaths are from unsafe abortions.

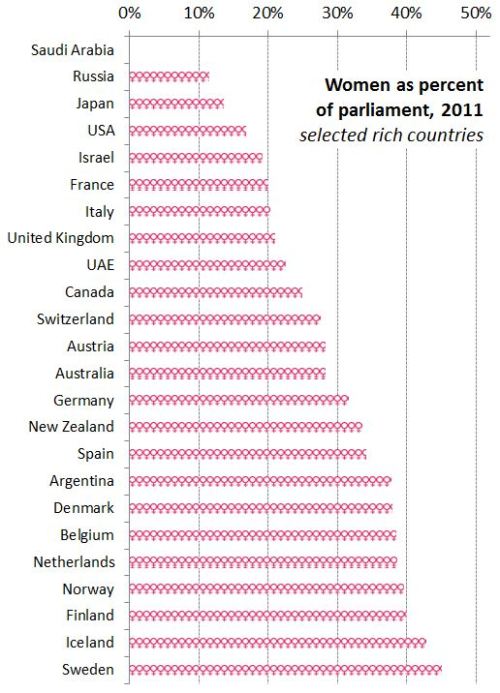
Finally, I made this one myself, showing women as a percentage of parliament in most of the world’s rich countries (the spreadsheet has the whole list). The USA, with 90 women out of 535 members of Congress, comes in at 17%.

The report focuses on law and justice issues, including rape and violence against women, as well as reparations, property rights, and judicial reform. They boil down their conclusions to: “Ten proven approaches to make justice systems work for women“:

1. Support women’s legal organizations

2. Support one-stop shops and specialized services to reduce attrition in the justice chain [that refers to rape cases, for example, not making their way from charge to conviction -pnc]

3. Implement gender-sensitive law reform

4. Use quotas to boost the number of women legislators

5. Put women on the front line of law enforcement

6. Train judges and monitor decisions

7. Increase women’s access to courts and truth commissions in conflict and post-conflict contexts.

8. Implement gender-responsive reparations programmes

9. Invest in women’s access to justice

10. Put gender equality at the heart of the Millennium Development Goals

Does American prosperity translate into long retirements?  Not compared to other developed countries in the world.  Flowing Data borrowed OECD numbers on life expectancy and age of retirement to calculate the average number of years in retirement for men and women across many different countries.  The portion of each bar with the line is the average number of years working, while the non-lined portion represents years in retirement.

Largely because of life expectancy, women enjoy more years than men in all states except Turkey, but the number of years varies quite tremendously, from an average of zero years for men in Mexico, to an average of 26 years for women in Austria and Italy.  The United States is way down on this list, not doing so well relatively after all.

Lisa Wade, PhD is an Associate Professor at Tulane University. She is the author of American Hookup, a book about college sexual culture; a textbook about gender; and a forthcoming introductory text: Terrible Magnificent Sociology. You can follow her on Twitter and Instagram.