nation: Mali

Cross-posted at Neuroskeptic.

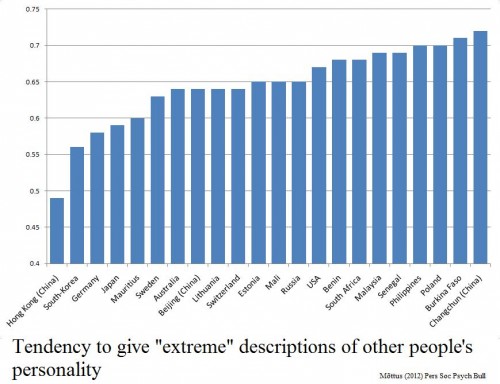
“Personality differences” between people from different countries may just be a reflection of cultural differences in the use of “extreme” language to describe people.

That’s according to a very important paper just out from an international team led by Estonia’s René Mõttus.

There’s a write up of the study here. In a nutshell, they took 3,000 people from 22 places and asked them to rate the personality of 30 fictional people based on brief descriptions (which were the same, but translated into the local language). Ratings were on a 1 to 5 scale.

It turned out that some populations handed out more of the extreme 1 or 5 responses. Hong Kong, South Korea and Germany tended to give middle of the road 2, 3 and 4 ratings, while Poland, Burkina Faso and people from Changchun in China were much more fond of 1s and 5s.

The characters they were rating were the same in all cases, remember.

Crucially, when the participants rated themselves on the same personality traits, they tended to follow the same pattern. Koreans rated themselves to have more moderate personality traits, compared to Burkinabés who described themselves in stronger tones.

Whether this is a cultural difference or a linguistic one is perhaps debatable; it might be a sign that it is not easy to translate English-language personality words into certain languages without changing how ‘strong’ they sound. However, either way, it’s a serious problem for psychologists interested in cross-cultural studies.

I’ve long suspected that something like this might lie behind the very large differences in reported rates of mental illness across countries. Studies have found that about 3 times as many people in the USA report symptoms of mental illness compared to people in Spain, yet the suicide rate is almost the same, which is odd because mental illness is strongly associated with suicide.

One explanation would be that some cultures are more likely to report ‘higher than normal’ levels of distress, anxiety — a bit like how some make more extreme judgements of personality.

So it would be very interesting to check this by comparing the results of this paper to the international mental illness studies. Unfortunately, the countries sampled don’t overlap enough to do this yet (as far as I can see).

Source: Mõttus R, et al (2012). The Effect of Response Style on Self-Reported Conscientiousness Across 20 Countries. Personality and Social Psychology Bulletin PMID: 22745332

————————

Neuroskeptic blogs anonymously here.  You can also follow him on Twitter.

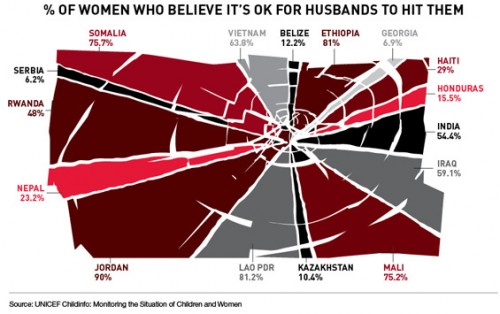
Teresa C. sent in this image created using UNICEF data to show what percent of women surveyed in various countries said it was acceptable for their husbands to hit them:

international-womens-attitudes-towards-domestic-v-28079-1250786064-13

(Found at BuzzFeed.)

You can find the data and a breakdown of UNICEF data collection methods here. The data for many more countries are available there too. I can’t quite figure out why these particular countries were used in the image; they aren’t all of the countries with the highest percentages. As far as I can tell, the UNICEF data table only includes numbers for the “developing” nations and some countries from eastern Europe, which is UNICEF’s focus. But I do wonder what the numbers would be if you asked women in the U.S. a question along the lines of “is it ever acceptable for a man to hit a woman?” or “can you think of any situation where it might be understandable that a man would hit his wife or girlfriend?” You might get higher “support” for violence against women than you’d think. The UNICEF page doesn’t provide the wording of this question, which would be interesting to know.

That’s not to downplay the issue of women justifying or accepting violence against women, just that those of us in the “developed” nations need to be sure not to pat ourselves on the back too much about how enlightened we are about domestic violence.

And I can’t help but dislike the image, in that at first glance it would appear to be a pie chart in which all of the sections add up to 100%; really a bar graph would be a better way to illustrate this. But then, I had a dissertation advisor with a 5-page single-spaced document outlining his standards for data presentation.

UPDATE: Reader P. makes the point I was getting at above (that the wording might greatly impact how much “support” you find for violence against women) much better than I did:

What they were actually asked, in the MICS and the DHS (the two primary sources for the data), was this question:

“Sometimes a husband is annoyed or angered by things that his wife does.  In your opinion, is a husband justified in hitting or beating his wife in the following situations:

– If she goes out with out telling him?
– If she neglects the children?
– If she argues with him?
– If she refuses sex with him?
– If she burns the food?”

I bet you get very different rates for different “justifications,” which is important both for data-gathering/presentation and for anti-domestic violence campaigns. And, again, I bet if you broke down various “reasons” for hitting a woman, I bet you’d get higher-than-expected acceptance of them in countries in the “developed” countries that weren’t presented in the table.