nation: Germany

UPDATE:  Since posting this, I’ve discovered that the numbers do not accurately reflect the ratio of CEO vs. worker pay.  Writes PolitiFact:

We don’t doubt the chart’s underlying point that the ratio of CEO pay to worker pay is high in the United States, and is likely higher in our free-wheeling economy than it is in the historically more egalitarian nations of Europe.

But in its claim that the U.S. ratio is 475 to 1, the chart conveys a sense of certitude and statistical precision that simply isn’t warranted — and which is contradicted by the facts. The latest number for the U.S. is 185 to 1 in one study and 325 to 1 in another [though in previous years, those ratios have reached as high as 525 to 1] — and those numbers were not generated by groups that might have an ideological interest in downplaying the gaps between rich and poor. We rate the claim on the U.S. ratio False.

I apologize for not vetting this more carefully.

H/T KeepYourHopesUpHigh via GlobalSociologyBlog.

Lisa Wade, PhD is an Associate Professor at Tulane University. She is the author of American Hookup, a book about college sexual culture; a textbook about gender; and a forthcoming introductory text: Terrible Magnificent Sociology. You can follow her on Twitter and Instagram.

Cross-posted at Family Inequality.

In 1994, Sara McLanahan and Gary Sandefur published, Growing Up With A Single Parent: What Hurts, What Helps. The growth of children living with only their mothers was — then as now — a matter of concern not only for children’s well-being, but for intergenerational mobility. One of their empirical conclusions was this:

For children living with a single parent and no stepparent, income is the single most important factor in accounting for their lower well-being as compared with children living with both parents. It accounts for as much as half of their disadvantage. Low parental involvement, supervision, and aspirations and greater residential mobility account for the rest.

The biggest problem, in other words, is economic. The other factors —  involvement, supervision, aspirations, mobility — are related to social class and the time poverty that economically-poor parents experience.

Examples

Here are some bivariate illustrations — that is, head-to-head comparisons of the difference between children of poor and non-poor versus single and married parents.

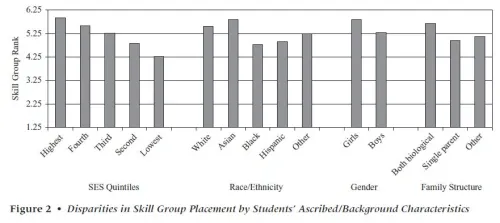
These are the “skill group” rankings by teachers of children by socioeconomic status (or SES, a composite of parents’ education, occupational prestige and income) versus race/ethnicity, gender and family structure. SES shows the widest spread in reading teachers’ group placement of first graders.

Source: Condron (2007)

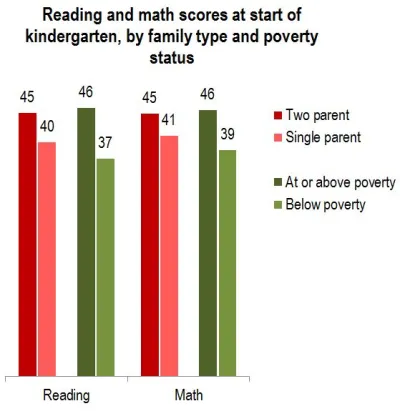
Similarly, the poor/nonpoor difference is greater than the two-parent/single-parent difference in kindergarten entry scores:

Source: Early Childhood Longitudinal Study (2009)

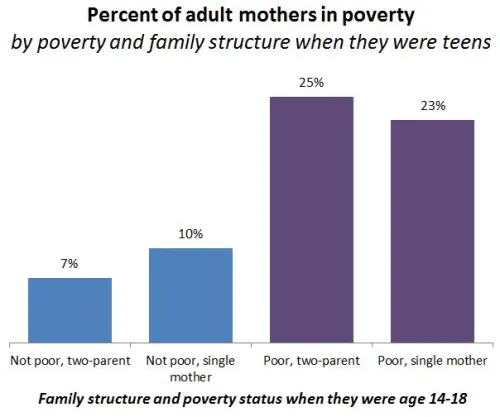
Those are just two examples from early-childhood assessments. More importantly, here is the breakdown seen in a longitudinal study of children growing up. When women grow up to be mothers, their poverty level in childhood is more important than their family structure for predicting whether they will be in poverty themselves. The poverty difference is large, the family structure difference is not:

Source: Musik & Mare (2006)

This study included a more sophisticated set of multivariate analyses than this simple graph, but the author’s conclusion fits it:

Net of the correlation between poverty and family structure within a generation, the intergenerational transmission of poverty is significantly stronger than the intergenerational transmission of family structure, and neither childhood poverty nor family structure affects the other in adulthood.

That is, childhood poverty matters more.

Fewer single parents, or less poverty?

But if single parenthood and poverty are so closely related, some people say, we should spend hundreds of millions of dollars promoting marriage to help children avoid poverty (and other problems). That’s what the government has done, with money from the welfare budget. Even if it worked, which it apparently doesn’t, it’s only one approach. What about reducing poverty? And, more specifically, reducing the relative likelihood of poverty in single-parent families versus those with married parents. That is, address the poverty gap between the two groups, rather than the size of the two groups. This has the added advantage of not singling out one group — single mothers — for social stigmatization (of the kind I mentioned here). And, because it defines the problem as economic rather than moral, may make it easier to build public support for helping the poor.

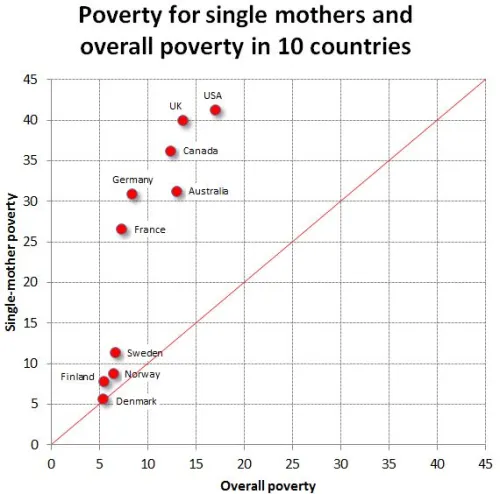
Consider a recent paper by David Brady and Rebekah Burroway, which will be published in Demography. They analyzed the relative poverty of single mothers versus the total population — that is, what percentage had incomes below half the median (per person, after accounting for taxes and government transfers). Such a relative poverty measure is really a measure of inequality, but specifically inequality at the low end. (Regardless of how rich the rich are, it’s theoretically possible to have no one below half the median income). Here is my graph showing that result, with only the countries that have reliable sample sizes in the survey:

The Nordic countries have the lowest overall poverty rates. But in absolute terms their advantage is much bigger for single mothers. (The red line shows equal poverty rates for single mothers and the total population.) The US and UK have the largest difference in poverty rates between single mothers and overall poverty. That is, we have the largest poverty penalty for single motherhood. If the relative poverty rates for single mothers were lower in the US, we might spend more time and money addressing poverty and less trying to change family structures.

Cross-posted at Reports from the Economic Front.

There is big trouble brewing in Europe.  John Ross, in his blog Key Trends in the World Economy, highlights this brewing crisis in a series of charts, some of which I repost below.

This first chart shows the extent of the recovery from the recent economic crisis in the U.S., the EU, and Japan.  While the U.S. GDP has finally regained its past business cycle peak, the same cannot be said for Europe (or Japan).  As of the 3rd quarter 2011, EU GDP was still 1.7% below its previous business cycle peak.  The Eurozone was 1.9% below.

Recent GDP estimates for the 4th quarter show European GDP once again contracting, which strongly suggests that the region is headed back into recession without having regained its previous business cycle peak.  This development implies that Europe faces serious stagnationist pressures.

gdp1.jpg

This chart looks at the growth record for the 5 largest European economies.  Germany has regained its previous GDP peak.  France is making progress toward that end.  These two countries account for 36.2% of European GDP.  However, things are quite different for the UK, Italy, and Spain.  These three countries account for 34.7% of European GDP and not only do they each remain far below their respective previous GDP peaks, their economies are once again heading downward.

gdp2.jpg

The third chart highlights the economic performance of the three countries which have received the most media attention because of fears that their governments will be unable to repay their respective debts.  They are clearly in trouble, adding to the downward pressure on European GDP.  However, despite all the attention paid to them, their combined economies are only one-eighth the size of the combined economies of the UK, Italy and Spain.

gdp3.jpg

The next two charts highlight the fact that economic trends are also dire throughout much of Eastern Europe.

gdp4.jpg

gdp5.jpg

The take-away is that European economic problems are not limited to a few smaller countries.  Some of the largest are also performing poorly and apparently headed back into recession without ever having regained their past business cycle peaks.  It is hard to see Europe escaping recession.  And it is hard to see the U.S., Asia, and Africa escaping the consequences.

How does the U.S. compare to other developed countries on measures of social justice? According to the New York Times, not very well.  The visual below compares countries’ poverty rates, poverty prevention measures, income inequality, spending on pre-primary education, and citizen health.  The “overall” rating is on the far left and the U.S. ranks 27th out of 31.


Via Feministing.  See also how the U.S. ranks on measures of equality and prosperity(33 out of 33, for what it’s worth). Thanks to Dolores R. for the link!

Lisa Wade, PhD is an Associate Professor at Tulane University. She is the author of American Hookup, a book about college sexual culture; a textbook about gender; and a forthcoming introductory text: Terrible Magnificent Sociology. You can follow her on Twitter and Instagram.

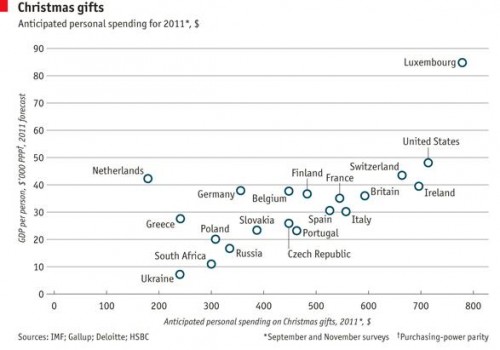
As we enter the last frenzied days of Christmas shopping, Dmitriy T.M. thought it was worth looking at international comparisons in spending on the holiday. The Economist posted a graph based on Gallup polls and other data sources about how much individuals in various countries in Europe, plus the U.S. and South Africa, plan to spend on Christmas shopping this year, plotted against national GDP. Overall, Christmas spending correlates with national wealth, with the Netherlands being a noticeable outlier (spending less than we’d expect) and Luxembourg in a spending league of its own:


Cross-posted at Montclair SocioBlog.

The equation of wealth and virtue seems to come almost naturally, at least among the wealthy.  The logic is simple:  Virtue leads to success, therefore wealth is evidence of one’s virtue.  Virtue, in this case, means the Protestant Ethic – hard work and a willingness to forgo or postpone pleasures.  It follows then that those who are not wealthy must have turned their back on virtue.

David Brooks, in his Friday column (here),  applies this explanation to the wealth of nations.

Why are nations like Germany and the U.S. rich? . . . It’s because many people in these countries believe in a simple moral formula: effort should lead to reward as often as possible.

People who work hard and play by the rules should have a fair shot at prosperity. Money should go to people on the basis of merit and enterprise. Self-control should be rewarded while laziness and self-indulgence should not.

The US, Germany, and the Netherlands are Brooks’s exemplars of these virtues (Brooks uses the word ethos).  The bad countries, the ones whose economies are teetering on the brink, are the grasshoppers to our ant.  There they were – Brooks points his finger at Greece, Italy, and Spain – fiddling and dancing the summer away, refusing to live within their means or “reinforce good values.”

This seems accurate, doesn’t it – the dolce far niente Italians and other Mediterraneans, taking hours at midday for meals and siestas while the industrious Americans, Germans, and Dutch are working away, wolfing down a sandwich at their desks.

Just to be sure I downloaded some OECD data from 2007 – the last year before the big crash – on the number of hours people in different countries work. (Brooks’s three “ant” countries are red, the “grasshoppers” dark blue.)This is puzzling.  The US is slightly above the OECD average, but workers in Greece and Italy spend more hours at work than do Americans, while the Dutch and Germans are down at the low end of the scale.  (I do not know why the OECD still gives data for West Germany as well as Germany.)

I noticed that the OECD also had a measure of “employment protection,” which is basically how hard it is to fire someone.  I figured that workers in non-virtuous countries would be highly protected.  Since it’s nearly impossible for them to be fired, they know they can slack off on the job.  By contrast, virtuous countries would foster Brook’s ethos of “effort, productivity and self-discipline”  in workers, rewarding the industrious, firing the lazy and self-indulgent.I wasn’t surprised that the US anchored the low end of the scale.  Workers here have less job-protection than those in any of the other countries.  And Greece and Spain are above the average.  But so are Germany and the Netherlands, though only slightly, while Italy is slightly below the average.  There’s really not much difference between these three.  And if you look at the array of countries, there seems to be no strong connection between job protection and how well the country is weathering the current long recession.  I’m not sure what the best measure of the overall economy is, but the OECD has composite figure made up from ten main economic indicators.* I just wish we had better measure of Brooks’s “ethos.”

——————-

*  “The Labour Force Survey (MEI) dataset itself covers countries that compile labour statistics from sample household surveys on a monthly or quarterly basis. It is widely accepted that household surveys are the best source for labour market key statistics. In such surveys, information is collected from people living in households through a representative sample. Surveys are based on standard methodology and procedures used all over the world. The 10 subjects available cover labour force, employment, unemployment (including harmonised unemployment), and employees.”


The U.S. economy is in trouble and that means trouble for the world economy.

According to a United Nations Conference on Trade and Development report, “Buoyant consumer demand in the United States was the main driver of global economic growth for many years in the run-up to the current global economic crisis.”

Before the crisis, U.S. household consumption accounted for approximately 16 percent of total global output, with imports comprising a significant share and playing a critical role in supporting growth in other countries.

…as a result of global production sharing, United States consumer spending increas[ed] global economic activities in many indirect ways as well (e.g. business investments in countries such as Germany and Japan to produce machinery for export to China and its use there for the manufacture of exports to the United States).

In short, a significant decline in U.S. spending can be expected to have a major impact on world growth, with serious blow-back for the United States.

There are those who argue that things are not so dire, that other countries are capable of stepping up their spending to compensate for any decline in U.S. consumption. However, the evidence suggests otherwise.As the chart below (from the report) reveals, consumption spending in the U.S. is far greater than in any other country; it is greater than Chinese, German, and Japanese consumption combined.

consumption.jpg

Moreover, there is little reason to believe that the Chinese, German, or Japanese governments are interested in boosting consumer spending in their respective countries.  All three governments continue to pursue export-led growth strategies that are underpinned by policies designed to suppress wage growth (lower wages = cheaper goods = stronger competitiveness in international markets).  Such policies restrict rather than encourage national consumption because they limit the amount of money people have to spend.

For example, China is the world’s fastest growing major economy and often viewed as a potential alternative growth pole to the United States.  Yet, the Economist reveals that the country’s growth has brought few benefits to the majority of Chinese workers.

picture1.jpg

According to the U.S. Bureau of Labor Statistics, despite several years of wage increases, Chinese manufacturing workers still only earn an average of  $1.36 per hour (including all benefits).  In relative terms, Chinese hourly labor compensation is roughly 4 percent of that in the United States.   It even remains considerably below that in Mexico.

Trends in Germany, the other high-flying major economy, are rather similar. As the chart below shows, the share of German GDP going to its workers has been declining for over a decade.  It is now considerably below its 1995 level.  In fact, the German government’s success in driving down German labor costs is one of the main causes of Europe’s current debt problems — other European countries have been unable to match Germany’s cost advantage, leaving them with growing trade deficits and foreign debt (largely owed to German banks).

germany.jpg

The Japanese economy, which remains in stagnation, is definitely unable to play a significant role in supporting world growth.  Moreover, as we see below, much like in the United States, China, and Germany, workers in Japan continue to produce more per hour while suffering real wage declines.

japan.gif

For a number of years, world growth was sustained by ever greater debt-driven U.S. consumer spending.  That driver now appears exhausted and U.S. political and economic leaders are pushing hard for austerity.  If they get their way, the repercussions will be serious for workers everywhere.

Our goal should not be a return to the unbalanced growth of the past but new, more stable and equitable world-wide patterns of production and consumption.  Achieving that outcome will not be easy, especially since as the United Nations Conference on Trade and Development’s World Investment Report 2011 points out, transnational corporations (including their affiliates) currently account for one-fourth of global GDP.Their affiliates alone produce more than 10 percent of global GDP and one-third of world exports.  And, these figures do not include the activities of many national firms that produce according to terms specified by these transnational corporations.   These dominant firms have a big stake in maintaining existing structures of production and trade regardless of the social costs and they exercise considerable political influence in all the countries in which they operate.

Cross-posted at Family Inequality.

I have criticized sloppy statistical work by some international feminist organizations, so I’m glad to have a chance to point out a useful new report and website.

The Progress of the World’s Women is from the United Nations Entity for Gender Equality and the Empowerment of Women. The full-blown site has an executive summary, a long report, and a statistics index page with a download of the complete spreadsheet. I selected a few of the interesting graphics.

Skewed sex ratios (which I’ve written about here and here) are in the news, with the publication of Unnatural Selection, by Mara Hvistendahl. The report shows some of the countries with the most skewed sex ratios, reflecting the practice of parents aborting female fetuses (Vietnam and Taiwan should  be in there, too). With the exception of Korea, they’ve all gotten more skewed since the 1990s, when ultrasounds became more widely available, allowing parents to find out the sex of the fetus early in the pregnancy.

The most egregious inequality between women of the world is probably in maternal mortality. This chart shows, for example, that the chance of a woman dying during pregnancy or birth is about 100- 39-times higher in Africa than Europe. The chart also shows how many of those deaths are from unsafe abortions.

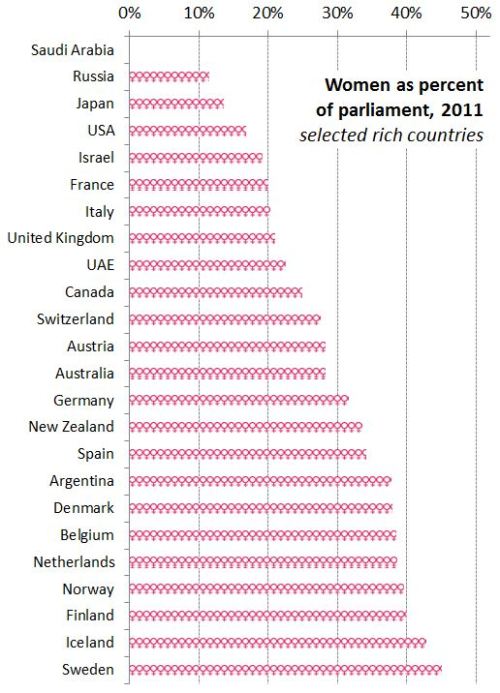
Finally, I made this one myself, showing women as a percentage of parliament in most of the world’s rich countries (the spreadsheet has the whole list). The USA, with 90 women out of 535 members of Congress, comes in at 17%.

The report focuses on law and justice issues, including rape and violence against women, as well as reparations, property rights, and judicial reform. They boil down their conclusions to: “Ten proven approaches to make justice systems work for women“:

1. Support women’s legal organizations

2. Support one-stop shops and specialized services to reduce attrition in the justice chain [that refers to rape cases, for example, not making their way from charge to conviction -pnc]

3. Implement gender-sensitive law reform

4. Use quotas to boost the number of women legislators

5. Put women on the front line of law enforcement

6. Train judges and monitor decisions

7. Increase women’s access to courts and truth commissions in conflict and post-conflict contexts.

8. Implement gender-responsive reparations programmes

9. Invest in women’s access to justice

10. Put gender equality at the heart of the Millennium Development Goals