nation: France

Cross-posted at Montclair SocioBlog.

According to an op-ed in the Times, America is the global leader in broadband, with high speeds and great service. And it’s all because the government restrained “onerous” regulation and let companies like Verizon do what they want and charge what they want.

It was written by the CEO of Verizon, Lowell McAdam.

I pay Mr. McAdam’s company about $115 each month for my land line, wi-fi, and cable (all FIOS).  Mr. McAdam compares the U.S. favorably with Europe, “where innovation and investment in advanced networks have stagnated under an onerous regulatory regime.”  I asked a friend who lives in Paris what he pays for his FIOS phone, wi-fi, and cable.  The monthly bill:  39.90€ ($52) or half of what I pay Verizon.  Maybe there’s an upside to stagnant and onerous.

There’s nothing wrong with getting what you can afford, and it occurred to me that U.S. broadband is the best because we can afford more.  Onerous regulations or no, most other countries are not as rich as the U.S.  What if you looked at broadband and per capita GDP?

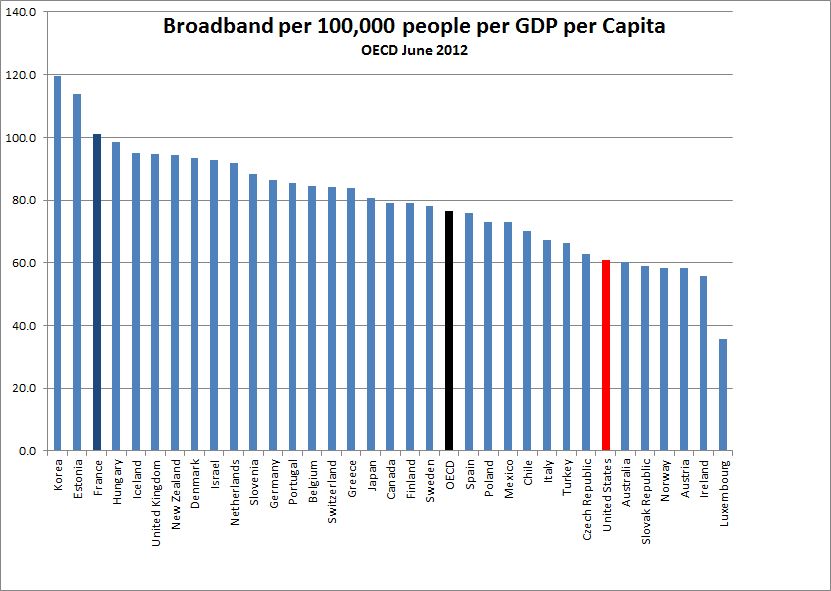
The OECD did just that with data from June 2012 (their several spreadsheets on this are here). The purple bars are broadband penetration and the bumpy red line is GDP per capita. Do you see a correlation?

1

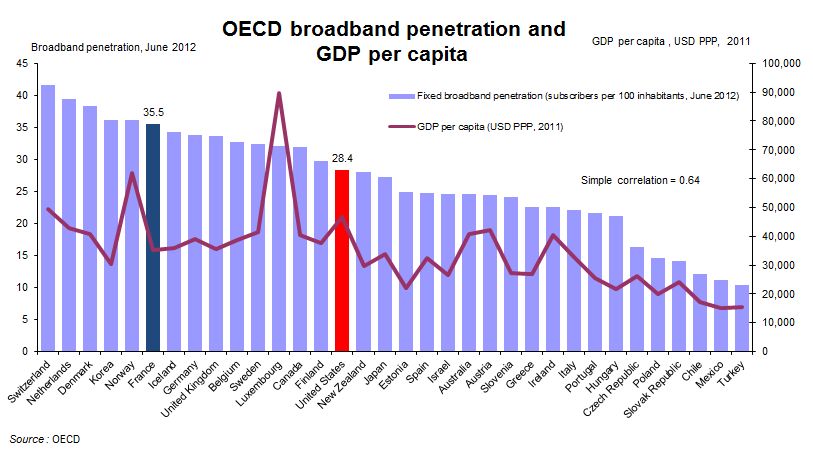
Consider France: As of a year ago, the country had greater broadband penetration despite a lower per capita GDP than the U.S. ($35,133 vs. $46,588); that’s 25% more broadband on 33% less income and at half the cost to consumers.

If you re-rank the OECD countries factoring in per capita GDP, the line-up changes.  Notably, the U.S. and Luxembourg drop well below the OECD average, despite being among the wealthiest countries.

2

Of course, not all broadbands are equally broad.  Verizon sold me on fiber-optic with their assurance that it was dazzlingly faster than their DSL that I had been clunking along on. This graph breaks down broadband into its various incarnations.

3

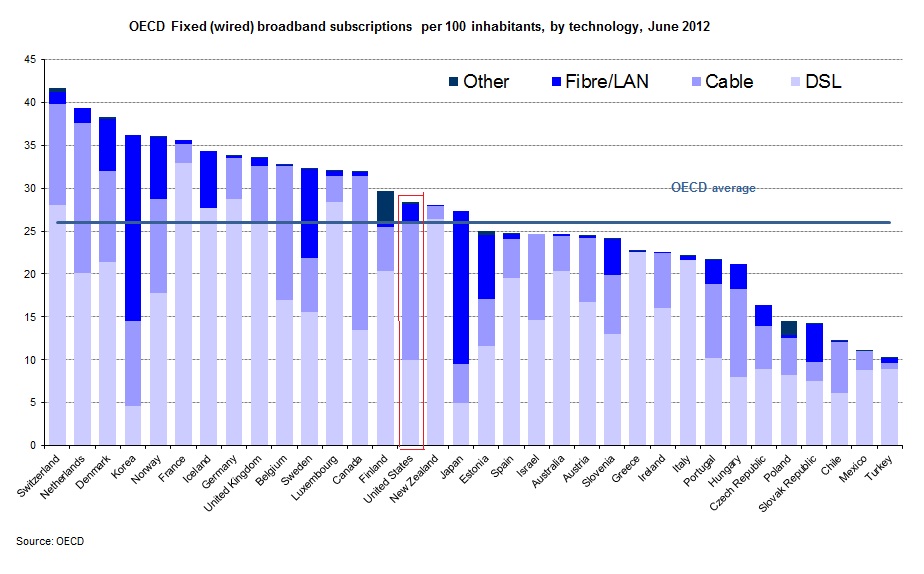
The U.S. is slightly above average on all broadband, but when it comes to a high fibre diet, we are ahead of several other countries that have greater total penetration.  On the other hand, the Scandinavian countries are ahead of us, as are, impressively, the Asian countries.

This is not to deny U.S. advances.  TechCrunch summarizes more recent data from Akamai on these changes:

the U.S. is currently second in the price of broadband for entry-level users. The nation is also third in network-based competition, second in the fiber-optic installation rate, first in the adoption of next-generation LTE, ahead of Europe in broadband adoption, and doing quite well in Internet-based services.

Still, the U.S. lags behind other, less wealthy countries.  InnovationFiles, using Akamai data for different variables, has a less congratulatory view.

  • The U. S. has picked up one place in the “Average Peak Connection Speed” that’s the best measurement of network capacity, rising from 14th to 13th as the measured peak connection speed increased from 29.6 Mbps to 31.5 Mbps.
  • In terms of the “Average Connection Speed,” widely cited by analysts who don’t know what it means, the U. S. remains in 8th place world-wide. but we’re no longer tied for it as we were in the previous quarter; Sweden is right behind us on this one.
  • In terms of “High Speed Broadband Adoption”, the proportion of IP addresses with an Average Connection Speed greater than 10 Mbps, we remain in 7th place, but now we’re tied with  Sweden.

The title of CEO McAdam’s op-ed is “How the US Got Broadband Right.”  Given the content, I  guess “We’re Number 13!” wouldn’t have been appropriate.  Even “We’re Number Seven (Tied With Socialist Sweden)!” doesn’t quite have that affirmative zing.

Jay Livingston is the chair of the Sociology Department at Montclair State University. You can follow him at Montclair SocioBlog or on Twitter.

The Pew Research Global Attitudes Project recently released data on attitudes about homosexuality in 39 countries. Generally, those living in the Middle East and Africa were the least accepting, while those in the Americas, Europe, and parts of Asia (the Philippines, Australia, and to a lesser extent Japan) were most accepting:

PG_13.06.04_HomosexualityAccept_620

Generally, the more religious a country, the less accepting its citizens are of homosexuality:

2013-Homosexuality-03

The proportion of people who support social acceptance of gays and lesbians ranged from a high of 88% in Spain to a low of 1% in Nigeria:

2013-Homosexuality-05

Attitudes about homosexuality vary widely by age. There is a pretty consistent global pattern of more positive attitudes among younger people, with a few exceptions:

2013-Homosexuality-01

Thus far, legalization of same-sex marriage has been largely confined to the Americas and Europe; New Zealand and South Africa are the two outliers:

FT_13.05.31_gayMarriageMap

The Pew Center points out that of the 15 nations that have fully extended marriage rights to same-sex couples, 8 have done so just since 2010. In the U.S., we’re currently awaiting a Supreme Court’s decision, which should arrive shortly, to know if we’ll be joining the list sooner rather than later.

Thanks to Peter Nardi at Pitzer College for the link!

Gwen Sharp is an associate professor of sociology at Nevada State College. You can follow her on Twitter at @gwensharpnv.

Cross-posted at Montclair SocioBlog.

Forty years ago Richard Easterlin proposed the paradox that people in wealthier countries were no happier than those in less wealthy countries.  Subsequent research on money and happiness brought modifications and variations, notably that within a single country, while for the poor, more money meant fewer problems, for the wealthier people — those with enough or a bit more — enough is enough.  Increasing your income from $100,000 to $200,000 isn’t going to make you happier.

It was nice to hear researchers singing the same lyrics we’ll soon be hearing in commencement speeches and that you hear in Sunday sermons and pop songs (“the best things in life are free”; “mo’ money mo’ problems”).  But this moral has a sour-grapes taste; it’s a comforting fable we non-wealthy tell ourselves all the while suspecting that it probably isn’t true.

A recent Brookings paper by Betsey Stevenson and Justin Wolfers adds to that suspicion.  Looking at comparisons among countries and within countries, they find that when it comes to happiness, you can never be too rich.

1

Stevenson and Wolfers also find no “satiation point,” some amount where happiness levels off despite increases in income.  They provide US data from a 2007 Gallup survey:

2

The data are pretty convincing.  Even as you go from rich to very rich, the proportion of “very satisfied” keeps increasing.  (Sample size in the stratosphere might be a problem: only 8 individuals reported annual incomes over $500,000;100% of them, though, were “very happy.”)

Did Biggie and Alexis get it wrong?

Around the time that the Stevenson-Wolfers study was getting attention in the world beyond Brookings, I was having lunch with a friend who sometimes chats with higher ups at places like hedge funds and Goldman Sachs.  He hears wheeler dealers complaining about their bonuses. “I only got ten bucks.”  Stevenson and Wolfers would predict that this guy’s happiness would be off the charts given the extra $10 million.  But he does not sound like a happy master of the universe.

I think that the difference is more than just the clash of anecdotal and systematic evidence.  It’s about defining and measuring happiness.  The Stevenson-Wolfers paper uses measures of “life satisfaction.”  Some surveys ask people to place themselves on a ladder according to “how you feel about your life.”  Others ask

All things considered, how satisfied are you with your life as a whole these days?

The GSS uses happy instead of satisfied, but the effect is the same:

Taken all together, how would you say things are these days – would you say that you are very happy, pretty happy, or not too happy?

When people hear these questions, they may think about their lives in a broader context and compare themselves to a wider segment of humanity.  I imagine that Goldman trader griping about his “ten bucks” was probably thinking of the guy down the hall who got twelve.  But when the survey researcher asks him where he is on that ladder, he may take a more global view and recognize that he has little cause for complaint.  Yet moment to moment during the day, he may look anything but happy.  There’s a difference between “affect” (the preponderance of momentary emotions) and overall life satisfaction.

Measuring affect is much more difficult — one method requires that people log in several times a day to report how they’re feeling at that moment — but the correlation with income is weaker.

In any case, it’s nice to know that the rich are benefitting from getting richer.  We can stop worrying about their being sad even in their wealthy pleasure and turn our attention elsewhere.  We got 99 problems, but the rich ain’t one.

Jay Livingston is the chair of the Sociology Department at Montclair State University. You can follow him at Montclair SocioBlog or on Twitter.

Cross-posted at Montclair SocioBlog.

The Washington Post has provided some data on medical costs across a selection of countries (Argentina, Canada, Chile, and India in grey; France, Germany, Switzerland, and Spain in blue; and the U.S. in red). The data reveal that American health care is very expensive compared to other countries.

1

No wonder the US spends twice as much as France on health care.  In 2009, the U.S. average was $8000 per person; in France, $4000.  (Canada came in at $4800).  Why do we spend so much?  Ezra Klein quotes the title of a 2003 paper by four health-care economists:  “it’s the prices, stupid.”

And why are US prices higher?  Prices in the other OECD countries are lower partly because of what U.S. conservatives would call socialism – the active participation of the government.  In the U.K. and Canada, the government sets prices.  In other countries, the government uses its Wal-Mart-like power as a huge buyer to negotiate lower prices from providers.  (If it’s a good thing for Wal-Mart to bring lower prices for people who need to buy clothes, why is it a bad thing for the government to bring lower prices to people who need to buy, say, an appendectomy? I could never figure that out.)

There may also be cultural differences between the U.S. and other wealthy countries, differences about whether greed, for lack of a better word, is good.  How much greed is good, and in what realms is it good?  Klein quotes a man who served in the Thatcher government:

Health is a business in the United States in quite a different way than it is elsewhere.  It’s very much something people make money out of. There isn’t too much embarrassment about that compared to Europe and elsewhere.

So we Americans roll along, paying several times what others pay for medical procedures, doctor visits, and drugs.

Jay Livingston is the chair of the Sociology Department at Montclair State University. You can follow him at Montclair SocioBlog or on Twitter.

The  International Society of Aesthetic Plastic Surgeons has released new data on the incidence of invasive and non-invasive cosmetic procedures.  The U.S. leads in sheer numbers of procedures but, accounting for population, we fall into 4th place.  South Korea leads for the number of procedures per person, followed by Greece and Italy.

1

By far the most common kinds of surgical cosmetic procedures are lipoplasty and breast augmentation.  Along with fat, breasts seem to be a particular concern: breast lifts and breast reductions for both men and women are also in the top ten.  Abdominoplasty, nose jobs, eyelid surgeries, and facelifts are as well.

2

The incidence of these surgeries is strongly related to everything from the gender binary to global power dynamics.  In 2008 we reported that male breast reductions were the most common cosmetic surgery for 13-19 year olds (boys and girls combined). You would be shocked at what counts as excess breast tissue and how little the before and after photos look.  Boys and men getting breast reductions, alongside women getting augmentations, is obviously about our desire for men and women to be different, not naturally-occurring difference.  See The Story of My Man-Boobs for more.

Likewise, we’ve posted about surgeries that create an epithelial fold, a fold of skin in the eyelid more common in people with White than Asian ethnic backgrounds.  This surgery is a trend among Asians and Asian-Americans, as colonization has left us with an association between Whiteness, attractiveness, and power.

The Economist summarizes some other trends:

Breast augmentation, the second biggest surgical procedure, is most commonly performed in America and Brazil. Buttock implants are also a Brazilian specialty, as is vaginal rejuvenation. Asia is keen on nose jobs: China, Japan and South Korea are among the top five nations for rhinoplasty.

More on where and how many procedures are being performed, but nothing on why, at the ISAPS report.

Image at The Economist; via Global Sociology.

Lisa Wade, PhD is an Associate Professor at Tulane University. She is the author of American Hookup, a book about college sexual culture; a textbook about gender; and a forthcoming introductory text: Terrible Magnificent Sociology. You can follow her on Twitter and Instagram.

Cross-posted at Montclair SocioBlog.

Back in June, Mitt Romney said:

I want to make sure that we keep America a place of opportunity, where everyone… get[s] as much education as they can afford

After all, Mitt got as much education as he (his parents, really) could afford, so he thought it best if everyone had that same opportunity.

Opportunity – How much is that in American money?

Yesterday, Planet Money  posted this graph showing the costs and benefits of a college education in several countries.

The title of the post summarizes the interpretation of the college-educated folks at Planet Money:

“College Costs More In America, But The Payoff Is Bigger”

But what if you look at the data from the other side?  Here’s the half-empty-glass title:

“College in the US Costs a Lot, and If You Can’t Afford It, You’re Really Screwed”

…or words to that effect.

What the chart seems to show is inequality — specifically, the inequality between the college educated and everyone else.  In advanced economies, like the those of the countries in the chart, education is important. But some of those countries, like the Scandinavian countries, have reduced the income sacrificed by non-college people relative to the college educated. Other countries favor a more unequal distribution of income.

To look a little closer, I looked at the relationship between the payoff of a BA degree for men and a country’s Gini coefficient, a measure of inequality.  I used the ten countries in the Planet Money chart and added another ten OECD countries.

The correlation is 0.44.  The US is the clear outlier.  In the land of opportunity, if you’re a male, either you pay the considerable price of going to college, or you pay the price for not going to college.

With this inequality come the kinds of social consequences that Charles Murray elaborates in his latest book about non-educated Whites — disability, divorce, demoralization, death.

—————————

Jay Livingston is the chair of the Sociology Department at Montclair State University.  You can follow him at Montclair SocioBlog or on Twitter.

Cross-posted at Montclair SocioBlog.

The poverty rate in the US in the mid-2000s was about 17%.  In Sweden, the poverty rate was 5.3%; in Germany, 11%.   That was the rate after adding in government transfers.  In Germany, the poverty rate before those transfers was 33.6%, ten points higher than that in the US.  Sweden’s pre-transfer poverty rate was about the same as ours.

Jared Bernstein has this chart showing pre-transfer and post-transfer rates for the OECD countries (click to enlarge):

Three  points:

1.  Governments have the power to reduce poverty, and reduce it a lot.  European governments do far more towards this goal than does the US government.

2.  It’s unlikely that America’s poor people are twice as lazy or unskilled or dissolute as their European counterparts.  Individual factors may explain differences between individuals, but these explanations have little relevance for the problem of overall poverty.  The focus on individual qualities also has little use as a basis for policy.  European countries have fewer people living in poverty, but not because those countries exhort the poor to lead more virtuous lives and punish them for their improvident ways.  European countries have lower poverty rates because the governments provide money and services to those who need them.

3.  The amount of welfare governments provide does not appear to have a dampening effect on the overall economy.

Cross-posted at Montclair SocioBlog.

As I speculated years ago (here and here), it may be hard for Americans to imagine a world where the law guarantees them at least 20 paid vacation days per year.  But such a world exists.  It’s called Europe.*

Americans are the lucky ones.  As Mitt Romney has warned us “European-style benefits” would   “poison the very spirit of America.”  Niall Ferguson, who weighs in frequently on history and economics, contrasts America’s “Protestant work ethic” with what you find in Europe – an “atheist sloth ethic.”

The graph is a bit misleading. It shows only what the law requires of employers.  Americans do get vacations.  But here in America, how much vacation you get, or whether you get any at all, and whether it’s paid – that all depends on what you can negotiate with your employer.

Since American vacations depend on what the boss will grant, some people get more paid vacation, some get less, and some get none.  So it might be useful to ask which sectors of our economy are beehives of the work ethic and which are sloughs of sloth.  (Ferguson’s employer, for example, Harvard University, probably gives him three months off in the summer, plus a week or two or more in the winter between semesters, plus spring break, and maybe a few other days.  I wonder how he would react if Harvard did away with these sloth-inducing policies.)

The Wall Street Journal recently (here) published a graph of BLS data on access to paid vacations; they break it up by industry near the bottom.

Those people who are cleaning your hotel room and serving your meals while you’re on vacation — only about one in four can get any paid vacation days.  And at the other end, which economic sector is most indulgent of sloth among its workforce?  Wall Street.  Four out of five there get paid vacation.

How much paid vacation do we get?  That depends on sector, but it also depends on length of service.  As the Journal says,

Europeans also get more time off: usually a bare minimum of four weeks off a year. Most Americans have to stay in a job for 20 years to get that much, according to BLS data.

—————————

* The graph is from five years ago, but I doubt things have changed much. The US still has no federal or state laws requiring any paid vacation days.