methods/use of data

Flashback Friday.

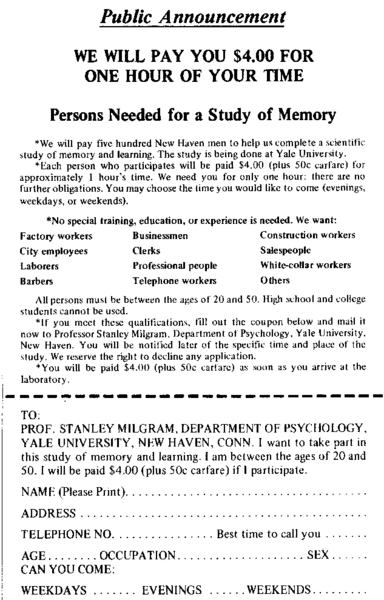
Bewildered by Nazi soldiers’ willingness to perpetuate the horrors of World War II, Stanley Milgram set out to test the extent to which average people would do harm if instructed by an authority figure. In what would end up being one of the most famous studies in the history of social psychology, the experimenter would instruct study subjects to submit a heard, but unseen stranger (who was reputed to have a heart condition) to a series of increasingly strong electric shocks. The unseen stranger (actually a tape recording) would yelp and cry and scream and beg… and eventually be silent. If the study subject expressed a desire to quit administering the shocks, the experimenter would prod four times:

1. Please continue.
2. The experiment requires that you continue.
3. It is absolutely essential that you continue.
4. You have no other choice, you must go on.

If, after four prods, the subject still refused to administer the shock, the experiment was over.

In his initial study, though all participants at some point required prodding, 65 percent of people (26 out of 40) continued to submit the stranger to electric shocks all the way up to (a fake) 450-volts, a dose that was identified as fatal and was administered after the screaming turned to silence. You can watch a BBC replication of the studies.

Originally posted in August 2010.

Lisa Wade, PhD is an Associate Professor at Tulane University. She is the author of American Hookup, a book about college sexual culture; a textbook about gender; and a forthcoming introductory text: Terrible Magnificent Sociology. You can follow her on Twitter and Instagram.

TW: racism  and sexual violence; originally posted at Family Inequality.

I’ve been putting off writing this post because I wanted to do more justice both to the history of the Black-men-raping-White-women charge and the survey methods questions. Instead I’m just going to lay this here and hope it helps someone who is more engaged than I am at the moment. I’m sorry this post isn’t higher quality.

Obviously, this post includes extremely racist and misogynist content, which I am showing you to explain why it’s bad.

This is about this very racist meme, which is extremely popular among extreme racists.

tumblr_n2i5w0kygo1qaeo2oo1_500

The modern racist uses statistics, data, and even math. They use citations. And I think it takes actually engaging with this stuff to stop it (this is untested, though, as I have no real evidence that facts help). That means anti-racists need to learn some demography and survey methods, and practice them in public. I was prompted to finally write on this by a David Duke video streamed on Facebook, in which he used exaggerated versions of these numbers, and the good Samaritans arguing with him did not really know how to respond.

For completely inadequate context: For a very long time, Black men raping White women has been White supremacists’ single favorite thing. This was the most common justification for lynching, and for many of the legal executions of Black men throughout the 20th century. From 1930 to 1994 there were 455 people executed for rape in the U.S., and 89% of them were Black (from the 1996 Statistical Abstract):

1996statabs-executions

For some people, this is all they need to know about how bad the problem of Blacks raping Whites is. For better informed people, it’s the basis for a great lesson in how the actions of the justice system are not good measures of the crimes it’s supposed to address.

Good data gone wrong

Which is one reason the government collects the National Crime Victimization Survey (NCVS), a large sample survey of about 90,000 households with 160,000 people. In it they ask about crimes against the people surveyed, and the answers the survey yields are usually pretty different from what’s in the crime report statistics – and even further from the statistics on things like convictions and incarceration. It’s supposed to be a survey of crime as experienced, not as reported or punished.

It’s an important survey that yields a lot of good information. But in this case the Bureau of Justice Statistics is doing a serious disservice in the way they are reporting the results, and they should do something about it. I hope they will consider it.

Like many surveys, the NCVS is weighted to produce estimates that are supposed to reflect the general population. In a nutshell, that means, for example, that they treat each of the 158,000 people (over age 12) covered in 2014 as about 1,700 people. So if one person said, “I was raped,” they would say, “1700 people in the US say they were raped.” This is how sampling works. In fact, they tweak it much more than that, to make the numbers add up according to population distributions of variables like age, sex, race, and region – and non-response, so that if a certain group (say Black women) has a low response rate, their responses get goosed even more. This is reasonable and good, but it requires care in reporting to the general public.

So, how is the Bureau of Justice Statistics’ (BJS) reporting method contributing to the racist meme above? The racists love to cite Table 42 of this report, which last came out for the 2008 survey. This is the source for David Duke’s rant, and the many, many memes about this. The results of Google image search gives you a sense of how many websites are distributing this:

imagesearch

Here is Table 42, with my explanation below:

table42-highlighted

What this shows is that, based on their sample, BJS extrapolates an estimate of 117,640 White women who say they were sexually assaulted, or threatened with sexual assault, in 2008 (in the red box). Of those, 16.4% described their assailant as Black (the blue highlight). That works out to 19,293 White women sexually assaulted or threatened by Black men in one year – White supremacists do math. In the 2005 version of the table these numbers were 111,490 and 33.6%, for 37,460 White women sexually assaulted or threatened by Black men, or:

everyday

Now, go back to the structure of the survey. If each respondent in the survey counts for about 1,700 people, then the survey in 2008 would have found 69 White women who were sexually assaulted or threatened, 11 of whom said their assailant was Black (117,640/1,700). Actually, though, we know it was less than 11, because the asterisk on the table takes you to the footnote below which says it was based on 10 or fewer sample cases. In comparison, the survey may have found 27 Black women who said they were sexually assaulted or threatened (46,580/1,700), none of whom said their attacker was White, which is why the second blue box shows 0.0. However, it actually looks like the weights are bigger for Black women, because the figure for the percentage assaulted or threatened by Black attackers, 74.8%, has the asterisk that indicates 10 or fewer cases. If there were 27 Black women in this category, then 74.8% of them would be 20. So this whole Black women victim sample might be as little as 13, with bigger weights applied (because, say, Black women had a lower response rate). If in fact Black women are just as likely to be attacked or assaulted by White men as the reverse, 16%, you might only expect 2 of those 13 to be White, and so finding a sample 0 is not very surprising. The actual weighting scheme is clearly much more complicated, and I don’t know the unweighted counts, as they are not reported here (and I didn’t analyze the individual-level data).

I can’t believe we’re talking about this. The most important bottom line is that the BJS should not report extrapolations to the whole population from samples this small. These population numbers should not be on this table. At best these numbers are estimated with very large standard errors. (Using a standard confident interval calculator, that 16% of White women, based on a sample of 69, yields a confidence interval of +/- 9%.) It’s irresponsible, and it’s inadvertently (I assume) feeding White supremacist propaganda.

Rape and sexual assault are very disturbingly common, although not as common as they were a few decades ago, by conventional measures. But it’s a big country, and I don’t doubt lots of Black men sexual assault or threaten White women, and that White men sexually assault or threaten Black women a lot, too – certainly more than never. If we knew the true numbers, they would be bad. But we don’t.

A couple more issues to consider. Most sexual assault happens within relationships, and Black women have interracial relationships at very low rates. In round numbers (based on marriages), 2% of White women are with Black men, and 5% of Black women are with White men, which – because of population sizes – means there are more than twice as many couples with Black-man/White-woman than the reverse. At very small sample sizes, this matters a lot. But we would expect there to be more Black-White rape than the reverse based on this pattern alone. Consider further that the NCVS is a householdsample, which means that if any Black women are sexually assaulted by White men in prison, it wouldn’t be included. Based on a 2011-2012 survey of prison and jail inmates, 3,500 women per year are the victim of staff sexual misconduct, and Black women inmates were about 50% more likely to report this than White women. So I’m guessing the true number of Black women sexually assaulted by White men is somewhat greater than zero, and that’s just in prisons and jails.

The BJS seems to have stopped releasing this form of the report, with Table 42, maybe because of this kind of problem, which would be great. In that case they just need to put out a statement clarifying and correcting the old reports – which they should still do, because they are out there. (The more recent reports are skimpier, and don’t get into this much detail [e.g., 2014] – and their custom table tool doesn’t allow you to specify the perceived race of the offender).

So, next time you’re arguing with David Duke, the simplest response to this is that the numbers he’s talking about are based on very small samples, and the asterisk means he shouldn’t use the number. The racists won’t take your advice, but it’s good for everyone else to know.

Philip N. Cohen is a professor of sociology at the University of Maryland, College Park. He writes the blog Family Inequality and is the author of The Family: Diversity, Inequality, and Social Change. You can follow him on Twitter or Facebook.

Last month the Washington Post released the results of a poll of self-identified Native Americans. It asked respondents whether they found the Washington Redsk*ns mascot offensive and 90% responded that they did not.

Dr. Adrienne Keene responded at Native Appropriations, where she has been blogging about Native issues, and the mascot issue, for years. She questioned the methods and her discussion is worth a read. It’s both a great example of uninformed/biased polling and an introduction to the politics of Native identity and citizenship.

She also questioned the logic behind doing the survey at all and that’s what I’d like to talk about here. “I just don’t understand why WaPo felt the need to do this poll,” Keene wrote. “We’ve got psychological studies, tribal council votes, thousands of Native voices, and common decency and respect on our side, yet that was not enough.” What is there left to understand?

“This is just an investment in white supremacy, plain and simple,” she concluded.

It’s hard to parse motivations, especially institutional ones, but it’s arguable that the effect of the poll was to shore up white supremacy by undermining decades of Native activism against the mascot, validating white people’s defense of it, and weakening challenges.

The owner of the Redsk*ins, Daniel Snyder, who strongly defends the use of the term, immediately pounced on the poll, writing in a statement:

The Washington Redskins team, our fans and community have always believed our name represents honor, respect and pride. Today’s Washington Post polling shows Native Americans agree. We are gratified by this overwhelming support from the Native American community, and the team will proudly carry the Redskins name.

By mid-afternoon the day the poll was released, Keene noted that there were already over 100 articles written about it, alongside repeated images of the Redsk*ns logo, an anachronistic depiction of an Indian wearing braids and feathers that portrays Native people as historical instead of contemporary.

4

And the poll very well might be used in the ongoing court battle over whether the Redsk*ns trademark can be pulled (federal law does not allow for trademarking racial slurs, so the fight is over whether the word is a slur or not).

Keene asks, “Who does this serve?”

It’s a good question, but questioning the motivation for the poll is just part of a larger and even more absurd question that anti-Redsk*ns activists are forced to ask: “Why is this even a fight?”

“We just want respect as human beings,” Keene implores. It would be easy to change the name. Quite easy. It just takes a decision to do it. Not even a democratic one. It wouldn’t even be particularly expensive. And fans would get over it. Why is it necessary to keep the name? Who does it serve? There is no doubt that the word redsk*ns is arguably offensive. Many Natives are and have been saying so. Why isn’t that enough? The fact that Snyder and other supporters defend the name so vociferously — the fact that this is even a conversation — is white supremacy, “plain and simple,” too.

Lisa Wade, PhD is an Associate Professor at Tulane University. She is the author of American Hookup, a book about college sexual culture; a textbook about gender; and a forthcoming introductory text: Terrible Magnificent Sociology. You can follow her on Twitter and Instagram.

Vox released the following figure this month, illustrating the results of an analysis by social media analytics company Crimson Hexagon. Excluding neutral stories, it shows the percentage of positive and negative media coverage for the final five candidates in the presidential primary. Clinton has received the most negative coverage and the least positive coverage.

2

As Jeff Stein at Vox notes, there may be more negative scrutiny of Clinton compared to Sanders because she’s widely considered to be the front-runner and that might not be good for Sanders, despite the greater positive coverage, because it could mark him as a non-contender.

Being the front-runner, though, doesn’t explain why Trump has received comparably less negative and more positive coverage.

Are these numbers reliable?

Well, the numbers were generated by algorithm. First Crimson Hexagon picked news outlets to include in their analysis. They did so by choosing the outlets that generated the most conversation on social media: Washington Post, Politico, Fox News, the Huffington Post, and CNN. So, one caveat is: if you’re using social media to get your news, you’re probably getting more negative coverage of Clinton compared to the other candidates. If you’re not, you may be exposed to a different balance of stories.

Next, they ran over 170,000 posts from these outlets through an “auto-sentiment” tool. It’s a computer program they built by hiring staff to manually code and enter hundreds of thousands of stories into a database as examples. The computer then searches for patterns between the positive, negative, and neutral stories and compares those patterns with un-coded stories that it sorts, anew, into those three categories.

So, a second caveat is, if you agree with their coding procedures (and trust their coders), then you will likely feel confident with the results. Their coding procedures, as far as I can tell, are proprietary, so we don’t get to evaluate them for ourselves.

One thing you might find easy to swallow though, even if you’re a skeptic, is how little positive news there is about anybody.

Lisa Wade, PhD is an Associate Professor at Tulane University. She is the author of American Hookup, a book about college sexual culture; a textbook about gender; and a forthcoming introductory text: Terrible Magnificent Sociology. You can follow her on Twitter and Instagram.

Polygraph‘s Hanah Anderson and Matt Daniels undertook a massive analysis of the dialogue of approximately 2,000 films, counting those characters who spoke at least 100 words. With the data, they’ve producing a series of visuals that powerfully illustrate male dominance in the American film industry.

We’ve seen data like this before and it tells the same disturbing story: across the industry, whatever the sub-genre, men and their voices take center stage.

7
They have some other nice insights, too, like the silencing of women as they get older and the enhancing of men’s older voices.

But knowledge is power. My favorite thing about this project is that it enables any of us — absolutely anyone — to look up the gender imbalance in dialogue in any of those 2,000 movies. This means that you can know ahead of time how well women’s and men’s voices are represented and decide whether to watch. The dialogue in Adaptation, for example, is 70% male; Good Will Hunting, 85% male; The Revenant, 100% male.

We could even let the site choose the movies for us. Anderson and Daniels include a convenient dot graph that spans the breadth of inclusion, with each dot representing a movie. You can just click on the distribution that appeals to you and choose a movie from there. Clueless, Gosford Park, and The Wizard of Oz all come in at a perfect 50/50 split. Or, you can select a decade, genre, and gender balance and get suggestions.

Polygraph has enabled us to put our money where our principles are. If enough of us decide that we won’t buy any movie that tilts too far male, it would put pressure on filmmakers to make movies that better reflected real life. This data makes it possible to do just that.

Lisa Wade, PhD is an Associate Professor at Tulane University. She is the author of American Hookup, a book about college sexual culture; a textbook about gender; and a forthcoming introductory text: Terrible Magnificent Sociology. You can follow her on Twitter and Instagram.

2 (1)There was a great article in The Nation last week about social media and ad hoc credit scoring. Can Facebook assign you a score you don’t know about but that determines your life chances?

Traditional credit scores like your FICO or your Beacon score can determine your life chances. By life chances, we generally mean how much mobility you will have. Here, we mean a number created by third party companies often determines you can buy a house/car, how much house/car you can buy, how expensive buying a house/car will be for you. It can mean your parents not qualifying to co-sign a student loan for you to pay for college. These are modern iterations of life chances and credit scores are part of it.

It does not seem like Facebook is issuing a score, or a number, of your creditworthiness per se. Instead they are limiting which financial vehicles and services are offered to you in ads based on assessments of your creditworthiness.

One of the authors of The Nation piece (disclosure: a friend), Astra Taylor, points out how her Facebook ads changed when she started using Facebook to communicate with student protestors from for-profit colleges. I saw the same shift when I did a study of non-traditional students on Facebook.

You get ads like this one from DeVry:

2 (1)

Although, I suspect my ads were always a little different based on my peer and family relations. Those relations are majority black. In the U.S. context that means it is likely that my social network has a lower wealth and/or status position as read through the cumulative historical impact of race on things like where we work, what jobs we have, what schools we go to, etc. But even with that, after doing my study, I got every for-profit college and “fix your student loan debt” financing scheme ad known to man.

Whether or not I know these ads are scams is entirely up to my individual cultural capital. Basically, do I know better? And if I do know better, how do I come to know it?

I happen to know better because I have an advanced education, peers with advanced educations and I read broadly. All of those are also a function of wealth and status. I won’t draw out the causal diagram I’ve got brewing in my mind but basically it would say something like, “you need wealth and status to get advantageous services offered you on the social media that overlays our social world and you need proximity wealth and status to know when those services are advantageous or not”.

It is in interesting twist on how credit scoring shapes life chances. And it runs right through social media and how a “personalized” platform can never be democratizing when the platform operates in a society defined by inequalities.

I would think of three articles/papers in conversation if I were to teach this (hint, I probably will). Healy and Fourcade on how credit scoring in a financialized social system shapes life chances is a start:

providers have learned to tailor their products in specific ways in an effort to maximize rents, transforming the sources and forms of inequality in the process.

And then Astra Taylor and Jathan Sadowski’s piece in The Nation as a nice accessible complement to that scholarly article:

Making things even more muddled, the boundary between traditional credit scoring and marketing has blurred. The big credit bureaus have long had sidelines selling marketing lists, but now various companies, including credit bureaus, create and sell “consumer evaluation,” “buying power,” and “marketing” scores, which are ingeniously devised to evade the FCRA (a 2011 presentation by FICO and Equifax’s IXI Services was titled “Enhancing Your Marketing Effectiveness and Decisions With Non-Regulated Data”). The algorithms behind these scores are designed to predict spending and whether prospective customers will be moneymakers or money-losers. Proponents claim that the scores simply facilitate advertising, and that they’re not used to approve individuals for credit offers or any other action that would trigger the FCRA. This leaves those of us who are scored with no rights or recourse.

And then there was Quinn Norton this week on The Message talking about her experiences as one of those marketers Taylor and Sadowski allude to. Norton’s piece summarizes nicely how difficult it is to opt-out of being tracked, measured and sold for profit when we use the Internet:

I could build a dossier on you. You would have a unique identifier, linked to demographically interesting facts about you that I could pull up individually or en masse. Even when you changed your ID or your name, I would still have you, based on traces and behaviors that remained the same — the same computer, the same face, the same writing style, something would give it away and I could relink you. Anonymous data is shockingly easy to de-anonymize. I would still be building a map of you. Correlating with other databases, credit card information (which has been on sale for decades, by the way), public records, voter information, a thousand little databases you never knew you were in, I could create a picture of your life so complete I would know you better than your family does, or perhaps even than you know yourself.

It is the iron cage in binary code. Not only is our social life rationalized in ways even Weber could not have imagined but it is also coded into systems in ways difficult to resist, legislate or exert political power.

Gaye Tuchman and I talk about this full rationalization in a recent paper on rationalized higher education. At our level of analysis, we can see how measurement regimes not only work at the individual level but reshape entire institutions. Of recent changes to higher education (most notably Wisconsin removing tenure from state statute causing alarm about the role of faculty in public higher education) we argue that:

In short, the for-profit college’s organizational innovation lies not in its growth but in its fully rationalized educational structure, the likes of which being touted in some form as efficiency solutions to traditional colleges who have only adopted these rationalized processes piecemeal.

And just like that we were back to the for-profit colleges that prompted Taylor and Sadowski’s article in The Nation.

Efficiencies. Ads. Credit scores. Life chances. States. Institutions. People. Inequality.

And that is how I read. All of these pieces are woven together and its a kind of (sad) fun when we can see how. Contemporary inequalities run through rationalized systems that are being perfected on social media (because its how we social), given form through institutions, and made invisible in the little bites of data we use for critical minutiae that the Internet has made it difficult to do without.

Tressie McMillan Cottom is an assistant professor of sociology at Virginia Commonwealth University.  Her doctoral research is a comparative study of the expansion of for-profit colleges.  You can follow her on twitter and at her blog, where this post originally appeared.

Flashback Friday.

A study published in 2001, to which I was alerted by Family Inequality, asked undergraduate college students their favorite color and presented the results by sex.  Men’s favorites are on the left, women’s on the right:

The article is a great example of the difference between research findings and the interpretation of those findings.  For example, this is how I would interpret it:

Today in the US, but not elsewhere and not always, blue is gendered male and pink gendered female.  We might expect, then, that men would internalize a preference for blue and women a preference for pink.  We live, however, in an androcentric society that values masculinity over femininity.  This rewards the embracing of masculinity by both men and women (making it essentially compulsory for men) and stigmatizes the embracing of femininity (especially for men).

We might expect, then, that men would comfortably embrace a love of blue (blue = masculinity = good), while many women will have a troubled relationship to pink (pink = femininity = devalued, but encouraged for women) and gravitate to blue and all of the good, masculine meaning it offers.

That’s how I’d interpret it.

Here’s how the authors of the study interpreted it:

…we are inclined to suspect the involvement of neurohormonal factors. Studies of rats have found average sex differences in the number of neurons comprising various parts of the visual cortex. Also, gender differences have been found in rat preferences for the amount of sweetness in drinking water. One experiment demonstrated that the sex differences in rat preferences for sweetness was eliminated by depriving males of male-typical testosterone levels in utero. Perhaps, prenatal exposure to testosterone and other sex hormones operates in a similar way to “bias” preferences for certain colors in humans.

Go figure.

Important lesson here: data never stands alone. It must always be interpreted.

Originally posted in 2010.

Lisa Wade, PhD is an Associate Professor at Tulane University. She is the author of American Hookup, a book about college sexual culture; a textbook about gender; and a forthcoming introductory text: Terrible Magnificent Sociology. You can follow her on Twitter and Instagram.

Daniel Drezner once wrote about how international relations scholars would react to a zombie epidemic. Aside from the sheer fun of talking about something as silly as zombies, it had much the same illuminating satiric purpose as “how many X does it take to screw in a lightbulb” jokes. If you have even a cursory familiarity with the field, it is well worth reading.

Here’s my humble attempt to do the same for several schools within sociology.

Public Opinion. Consider the statement that “Zombies are a growing problem in society.” Would you:

  1. Strongly disagree
  2. Somewhat disagree
  3. Neither agree nor disagree
  4. Somewhat agree
  5. Strongly agree
  6. Um, how do I know you’re really with NORC and not just here to eat my brain?

Criminology. In some areas (e.g., Pittsburgh, Raccoon City), zombification is now more common that attending college or serving in the military and must be understood as a modal life course event. Furthermore, as seen in audit studies employers are unwilling to hire zombies and so the mark of zombification has persistent and reverberating effects throughout undeath (at least until complete decomposition and putrefecation). However, race trumps humanity as most employers prefer to hire a white zombie over a black human.

Cultural toolkit. Being mindless, zombies have no cultural toolkit. Rather the great interest is understanding how the cultural toolkits of the living develop and are invoked during unsettled times of uncertainty, such as an onslaught of walking corpses. The human being besieged by zombies is not constrained by culture, but draws upon it. Actors can draw upon such culturally-informed tools as boarding up the windows of a farmhouse, shotgunning the undead, or simply falling into panicked blubbering.

Categorization. There’s a kind of categorical legitimacy problem to zombies. Initially zombies were supernaturally animated dead, they were sluggish but relentlessness, and they sought to eat human brains. In contrast, more recent zombies tend to be infected with a virus that leaves them still living in a biological sense but alters their behavior so as to be savage, oblivious to pain, and nimble. Furthermore, even supernatural zombies are not a homogenous set but encompass varying degrees of decomposition. Thus the first issue with zombies is defining what is a zombie and if it is commensurable with similar categories (like an inferius in Harry Potter). This categorical uncertainty has effects in that insurance underwriters systematically undervalue life insurance policies against monsters that are ambiguous to categorize (zombies) as compared to those that fall into a clearly delineated category (vampires).

Neo-institutionalism. Saving humanity from the hordes of the undead is a broad goal that is easily decoupled from the means used to achieve it. Especially given that human survivors need legitimacy in order to command access to scarce resources (e.g., shotgun shells, gasoline), it is more important to use strategies that are perceived as legitimate by trading partners (i.e., other terrified humans you’re trying to recruit into your improvised human survival cooperative) than to develop technically efficient means of dispatching the living dead. Although early on strategies for dealing with the undead (panic, “hole up here until help arrives,” “we have to get out of the city,” developing a vaccine, etc) are practiced where they are most technically efficient, once a strategy achieves legitimacy it spreads via isomorphism to technically inappropriate contexts.

Population ecology. Improvised human survival cooperatives (IHSC) demonstrate the liability of newness in that many are overwhelmed and devoured immediately after formation. Furthermore, IHSC demonstrate the essentially fixed nature of organizations as those IHSC that attempt to change core strategy (eg, from “let’s hole up here until help arrives” to “we have to get out of the city”) show a greatly increased hazard for being overwhelmed and devoured.

Diffusion. Viral zombieism (e.g. Resident Evil, 28 Days Later) tends to start with a single patient zero whereas supernatural zombieism (e.g. Night of the Living Dead, the “Thriller” video) tends to start with all recently deceased bodies rising from the grave. By seeing whether the diffusion curve for zombieism more closely approximates a Bass mixed-influence model or a classic s-curve we can estimate whether zombieism is supernatural or viral, and therefore whether policy-makers should direct grants towards biomedical labs to develop a zombie vaccine or the Catholic Church to give priests a crash course in the neglected art of exorcism. Furthermore, marketers can plug plausible assumptions into the Bass model so as to make projections of the size of the zombie market over time, and thus how quickly to start manufacturing such products as brain-flavored Doritos.

Social movements. The dominant debate is the extent to which anti-zombie mobilization represents changes in the political opportunity structure brought on by complete societal collapse as compared to an essentially expressive act related to cultural dislocation and contested space. Supporting the latter interpretation is that zombie hunting militias are especially likely to form in counties that have seen recent increases in immigration. (The finding holds even when controlling for such variables as gun registrations, log distance to the nearest army administered “safe zone,” etc.).

Family. Zombieism doesn’t just affect individuals, but families. Having a zombie in the family involves an average of 25 hours of care work per week, including such tasks as going to the butcher to buy pig brains, repairing the boarding that keeps the zombie securely in the basement and away from the rest of the family, and washing a variety of stains out of the zombie’s tattered clothing. Almost all of this care work is performed by women and very little of it is done by paid care workers as no care worker in her right mind is willing to be in a house with a zombie.

Applied micro-economics. We combine two unique datasets, the first being military satellite imagery of zombie mobs and the second records salvaged from the wreckage of Exxon/Mobil headquarters showing which gas stations were due to be refueled just before the start of the zombie epidemic. Since humans can use salvaged gasoline either to set the undead on fire or to power vehicles, chainsaws, etc., we have a source of plausibly exogenous heterogeneity in showing which neighborhoods were more or less hospitable environments for zombies. We show that zombies tended to shuffle towards neighborhoods with low stocks of gasoline. Hence, we find that zombies respond to incentives (just like school teachers, and sumo wrestlers, and crack dealers, and realtors, and hookers, …).

Grounded theory. One cannot fully appreciate zombies by imposing a pre-existing theoretical framework on zombies. Only participant observation can allow one to provide a thick description of the mindless zombie perspective. Unfortunately scientistic institutions tend to be unsupportive of this kind of research. Major research funders reject as “too vague and insufficiently theory-driven” proposals that describe the intention to see what findings emerge from roaming about feasting on the living. Likewise IRB panels raise issues about whether a zombie can give informed consent and whether it is ethical to kill the living and eat their brains.

Ethnomethodology. Zombieism is not so much a state of being as a set of practices and cultural scripts. It is not that one is a zombie but that one does being a zombie such that zombieism is created and enacted through interaction. Even if one is “objectively” a mindless animated corpse, one cannot really be said to be fulfilling one’s cultural role as a zombie unless one shuffles across the landscape in search of brains.

Conversation Analysis.2 (1)

Cross-posted at Code and Culture.

Gabriel Rossman is a professor of sociology at UCLA. His research addresses culture and mass media, especially pop music radio and Hollywood films, with the aim of understanding diffusion processes. You can follow him at Code and Culture.