geography/maps

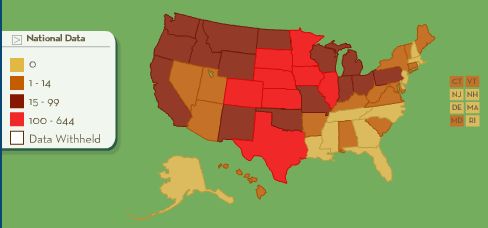
Emily K. sent in a link to the Southern Poverty Law Center’s 2009 report on hate groups in the U.S. Here’s a map (larger, not-stretched-out version available as a pdf here):

splc_hategroups208

The site also has an interactive map where you can select individual states and get more info on the hate groups that are active there, and another where “hate incidents” are marked.

Sorry for the sporadic posting lately–it’s the last week of the semester and I’m grading constantly.

UPDATE: One of my best friends just informed me that when investigating the SPLC hate incidents map, he realized he knew one of the people listed as a perpetrator in an incident in a certain Southern state; I promised to give no more details than that. This led to a discussion of the weirdness of some of the folks we grew up with, including a guy I went to school with who washed his head in gasoline to try to kill lice and ended up setting his entire head on fire. And no, I don’t know why a person would decide to use gasoline to kill lice. I also don’t know how one of my uncles managed to shoot himself in the foot while elk hunting, why that didn’t deter another uncle from going, falling down a mountain slope, and cracking his ribs, or why my mom married an evangelical Christian who didn’t like women to wear pants eight weeks after she met him on the internet. These are some of the many mysteries of life.

ANOTHER UPDATE: Commenter OP Minded says,

Kind of outrageous that the SPLC has “Concerned Citizens and Friends of Illegal Immigration Law Enforcement” in Framingham, MA listed as a hate group. There is no doubt that they are in favor of enforcing immigration law (after all, it is the law) but they don’t fall anywhere near a “hate group”. Calls into question this entire list.

Another commenter says,

To follow up on opminded@2: It’s too bad the Southern Poverty Law Center also uses these trumped-up threats to pad its already-deep coffers. Less than 70 percent of its expenses go toward its programs; the rest is for administration and fundraising.  Any human rights organization with almost $220 million in net assets isn’t doing its job.

The anonymous commenter suggests going to Charity Navigator to get more information.

I did not know about these criticisms (a problem in general about charities is not knowing for sure how the money is spent). My experience with the SPLC relates to their work with African American farmers in the South, a group that has experienced major land loss due to various factors largely involving racism and unscrupulous land developers. Their work on that particular issue was considered pretty solid. But of course there aren’t all that many organizations working on that problem, so any efforts were greatly appreciated.

Thanks for the additional info!

ANOTHER UPDATE: Commenter CLL says,

Over the years, SPLC has done terrific work helping people with little access to power receive the justice they deserve. Groups the SPLC has identified as “hate” groups have gone beyond simply disagreeing with policy (or lack of enforcement), and have instead encouraged their adherents to express discontent in more direct attacks on the object(s) of their scorn — thus qualifying as “hate” groups.

Spending 69.6% of income on programs remains a pretty normal ratio for not-for-profits that rely heavily on professional staff. Some organizations play fast and loose with their Fundraising allocations to cook the percentages down to numbers that look better on sites like Charity Navigator — but the proof of effectiveness is in accomplishment of mission.

An interesting representation of  flu pandemics (full size found here) throughout history.

flu-pandemics2

The US National Archives has a wonderful set of images (like the one below) related to The Influenza Epidemic of 1918.

flu-typist

Food & Water Watch has an interesting interactive map that allows you to click on states and see how many factory farms it has per county, broken down into cattle (meaning beef, I assume), hogs, dairy, broilers, and layers (the last two are both chickens). You can look at number of facilities or number of animals. Here’s a screenshot of the number of cattle containment facilities in the U.S.:

picture-1

Factory farms were identified using Census of Agriculture data and counting those that “best match the Environmental Protection Agency’s definition for a confined animal feeding operation…” based on the following guidelines:

picture-11

There’s a very detailed description of the methodology available here and an explanation of the maps here.

Andrew over at FiveThirtyEight posted three maps that show which candidate would have carried each state if only members of one social class voted (in case it’s not obvious, blue = Obama and red = McCain):

pewmaps

For the purposes of the estimate, “rich” was defined as a household income of $150,000+, “middle-income” was $40,000-75,000, and “poor” was $0-20,000. [Note: for the point of illustration, he just made maps showing the lowest, middle, and upper 20% of households by income, which is why the groups between $20,000-39,000 and $76,000-150,000 don’t show up here–he just made the 3 maps to illustrate the point.]

So what we seem to see here is that poor voters were more consistently partisan than rich voters, at least in the 2008 election. Whether this is a general pattern or something unique to 2008 I don’t know.

Fellow Contexts blogger Flaneuse over at Graphic Sociology posted this map showing increases in milk production by region:

milk_production_us

As we see, overall production has been more or less stable in most regions but has increased dramatically in the Pacific and Mountain regions.

This data hides another pattern, however: changes in average dairy herd size. Dairy operations in the West and Pacific regions tend to be significantly larger than dairy farms in the more traditional dairy states in the Great Lakes region and the Northeast. I went to the 2007 Census of Agriculture site and grabbed some data to do a few quick calculations. I chose two states in the western U.S. and two in the traditional Dairy Belt, just for illustrative purposes:

picture-18

All calculations use data available in Table 17 in the Census reports for the total U.S. and each individual state, which you can easily access at the link above if you want to check my numbers. I rounded everything off to the next highest whole number except for the two percentages in the lower right-hand cells, where doing so would greatly over-represent the percent of farms of that size.

In general, dairy farms with more than 500 milking cows are considered very large in the industry. Those with over 2500 cows are really extremely large, though there are dairies with more than 10,000 milking cows (including the Vander Eyk dairy, which supplies organic milk to be sold under the Horizon brand, as well as conventional, non-organic milk to other companies). But I digress.

Anyway, clearly we see that farms in California and Idaho (and the other Pacific/Mountain states) are larger, on average, than dairy farms in the traditional dairy states. The increase in milk production in the western U.S. is due predominantly to increases in the number (and herd sizes) of very large industrial dairies.

The growth of these large dairies depends on very cheap rates for water used to irrigate agricultural land. Those dairies have to grow lots of alfalfa and other feed crops to feed so many cows, since they certainly can’t afford enough land to have thousands of cows on pasture. And big dairies produce enormous amounts of manure that have to be carted off somewhere each day, meaning they often have big manure lagoons where they store it (as well as spraying as much as possible on fields). The lagoons are lovely, if you haven’t ever been really close to one, or perhaps nearly fallen into one while conducting research for your thesis. Not that I know anyone who has had such an experience. Point being, the competitive success of large western dairies is dependent on favorable political conditions (such as decisions to keep agricultural water rates lower than other water usage rates), and they have significant environmental consequences when we consider the use of water for irrigation in states that are often relatively arid and potential pollution from manure runoff.

I have some issues with Flaneuse’s implication that the growth of western dairies is a fairly natural result of population growth because milk is a localized commodity. I don’t know that you can really call milk a localized product these days–California milk is for sale in every state, and CA has aggressively marketed the state’s dairy industry with their “Happy cows” campaign. I can also buy milk from dairies in Minnesota here in Vegas, if I look a bit. So while I’m sure population growth has a role, I think it’s important to look at the political factors–particularly environmental laws as they apply to agriculture and local opposition to large dairies–that encourage the growth of huge industrial dairies in some regions more than others.

Also keep in mind, the production of milk when measured in pounds doesn’t just indicate there are more dairies or more dairy cows…it can also be the result of getting more pounds of milk per year per cow through the use of technologies such as bovine growth hormone (rBGH). I’m not up on rates of use of rBGH by region right at the moment, but I do know its use is nearly universal in industrial dairies; if smaller dairies in the midwest are less likely to use rBGH for various reasons (including concerns about customer opposition), that would also have an impact on where milk production is increasing most rapidly.

That was a lot of rambling to have just added one little image to what was in the original post at Graphic Sociology, but soc of ag is my specialty area and I geek out about it sometimes. You have no idea how much I reined myself in to tell you just this much about the dairy industry!

[Note: If you’re really super interested in this and don’t mind reading academic articles, I suggest an article by Jess Gilbert and Raymond Akor (1988) “Increasing Structural Divergence in U.S. Dairying: California and Wisconsin since 1950,” Rural Sociology 53(1): 56-72. They lay out some of the effects of politics, water subsidies, technological change, etc., and how they’ve favored a particular type of dairy system in the West. Also check out the Program on Agricultural Technology Studies at the University of Wisconsin, which has links to lots of easy-to-understand reports about trends in the dairy industry.]

Political donations are by law public. With this information, someone has put up a website which shows, on google maps, which households (in the Bay Area, Salt Lake City, and Orange and L.A. Counties) donated money to Proposition 8 (California’s successful proposition to prohibit gay marriage). When you click on the arrow, it also tells you the name of the person in the household, that persons occupation and employer, and how much money they donated. Take a look.

Over at The Daily Dish, one person is quoted saying:

What could possibly be the use of this kind of information, presented in this way? It’s intended to intimidate people into not participating in politics by donating money. Do that, and you’ll end up on some activist group’s map, with hotheads being able to find your street address on their iPhones.

Andrew Sullivan weighs in:

I don’t get the fear. If Prop 8 supporters truly feel that barring equality for gay couples is vital for saving civilization, shouldn’t they be proud of their financial support? Why don’t they actually have posters advertizing their support for discriminating against gay people – as a matter of pride?

Elsewhere on the same website, a reader writes in:

I zoomed in on the cities and neighborhoods where my relatives live.  What do I find but that one of my own aunts, in San Diego, contributed $200 to the Prop 8 cause last summer.  This same aunt, a good person I honestly believe, has even invited me and my partner to stay with in her family’s home. Call me naive, but I’m kind of having trouble wrapping my brain around this seeming contradiction.

This back and forth raises some interesting questions:

Is the map violating some sort of privacy? If not technical, legal privacy, then some sort of cultural agreement about how far is “too far”?

Is the first commenter correct that this is essentially a nefarious act? Should political donations be public in this brave new world of google maps and internet access? Has “public” taken on a whole new meaning here?

Then again, the right to free speech protects a lot more aggressive and heinous things than this google map. Is the first commenter overreacting?

And what of Andrew Sullivan’s comment? Are those who donated proud to see themselves on the map? Or are they ashamed?  When political action is unpopular (not that I’m sure this one is), does that change the nature of participation? Should holders of unpopular political beliefs be protected, perhaps by allowing them to donate anonymously?  Or is shaming part of how cultural change happens and, thus, a perfectly legitimate strategy on behalf of gay rights?

Further, maybe people like the last commenter deserve to know if their friends or relatives are donating to political causes that discriminate against them?  Then again, does the Aunt have any right to be able to donate to the cause without disrupting her relationships with her family?

Thoughts?  Other questions you think this brings up?

Breck C. sent in this story in the Wall Street Journal about a study showing a link between geography and personality– that is, that different personality traits are dominant in different regions of the U.S. Personality traits were measured by answers to the Big Five Personality Test, which is widely used in psychology and other fields to determine a person’s dominant personality traits. The story was accompanied by maps showing where five traits (extraversion, agreeableness, conscientiousness, neuroticism, and openness) are dominant. According to the study, many stereotypes, such as the neurotic East Coaster, have a basis in reality.

Here is a screenshot of the map of conscientiousness:

Leaving aside any questions about personality questionnaires, and whether people are very accurate at reporting their own personality traits, what I found interesting here is the explanation of this pattern in the caption above the map (which I’m assuming was written by someone at the WSJ and didn’t come from the study): perhaps the Great Plains region is conscientious because of “pioneer traditions” reinforced by “the daily demands of farming.” On the other hand, it’s “surprising” that people in the Southwest and Southeast would be conscientious.

This is a great example of a non-scientific explanation of data that relies more on stereotypes and assumptions than anything else. Why would pioneer traditions be any stronger in Kansas and Missouri than in Oregon or Montana (or a number of other states) that were also settled by “pioneers” (however you want to define that term)? I’m unclear whether the reference to farming is meant to describe the past or the present, but either way, it’s suspect. Lots of other states (including those surprisingly conscientious states in the Southwest and Southeast and many of the less conscientious states) have farming traditions, as well as important agricultural sectors today (like, say, Iowa and its corn). The vast majority of people in those conscientious states aren’t engaged in agriculture today. And for that matter, why would the “demands of farming” lead to conscientiousness in a way that other types of work wouldn’t? These seems to play on stereotypes of farmers (and rural folk more generally) as hard-working, honest, salt-of-the-earth types, compared to superficial, rude (but hipper) city dwellers.

It’s the type of unsophisticated, stereotypical interpretation of academic studies that I often see in the media, and I think this particular explanation of why these states would be conscientious is just silly.

Thanks for the link, Breck!

From popvssoda.com

You can find other maps of regional language usage here.