economics

The current political discourse is so focused on a single form of government revenue, that the word taxes has become essentially synonymous with just one tax in particular; the federal income tax.  In fact, unless there is a foreign policy crisis, the federal income tax usually dominates most political discussion given how the federal budget (or increasingly the federal debt) relates to almost anything and everything the federal government does (or does not do in more and more instances).

For example, during the closing months of 2012 we watched how a fight over a sunset of the Bush Tax Cuts almost shoved the United States over a fiscal cliff.  Just prior to this near crisis, the most discussed difference between 2012 presidential candidates was their disagreement about a 4 point increase in the highest federal income bracket.  Also, Mitt Romney will likely be remembered mostly for his disparagement and disregard of “The 47% of United States Citizens who pay no federal income tax.”

However, limiting discussion about government funding and spending to just the federal income tax and ignoring the other types of payments we make to the treasury is not without consequence, especially given how the federal income tax is actually a very unique kind of tax.  Unlike excise taxes, payroll deductions, sales taxes and most property taxes that are regressive or require the poor to pay a larger proportion of their resources than the wealthy; the federal income tax is one of the few progressive taxes in the United States because at least on paper (I say that because these marginal rates often do not equate the larger effective rates given that the wealthy are afforded more loopholes, deductions, and lower rates on investment income), the rich pay larger marginal rates than the middle-class and poor.   Thus, with our political discussion largely limited to the federal income tax, it should come as no surprise conservatives are so easily able to frame “The State,” especially the federal government, as a perverse Robin Hood who steals from the rich (the makers as they are being called now) to give to the poor (the takers).

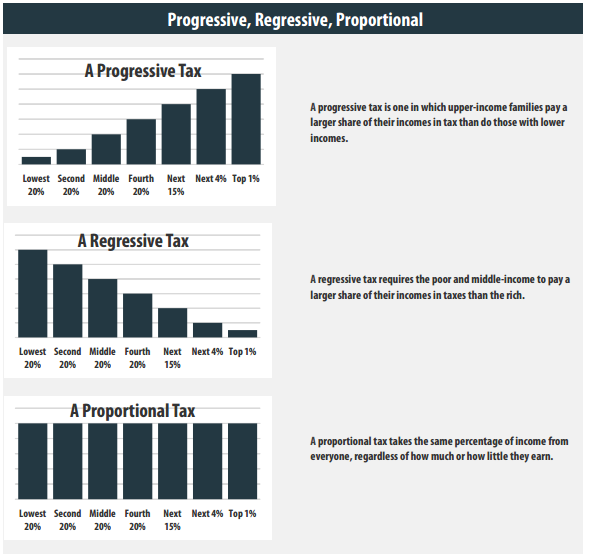
The non-profit, non-partisan Institution on Taxation and Economic Policy recently released its research on the taxes families in the United States paid in 2010.  These findings reveal when the focus is taken off the federal income tax and the entire tax system is examined, cumulative household taxes in nearly every state are regressive because the less money a family makes, the larger proportion they pay to the different levels of government.  As the graph below shows, the cumulative tax system is regressive because sales, excise and property taxes offset progressive income taxes at both the state, and federal levels.

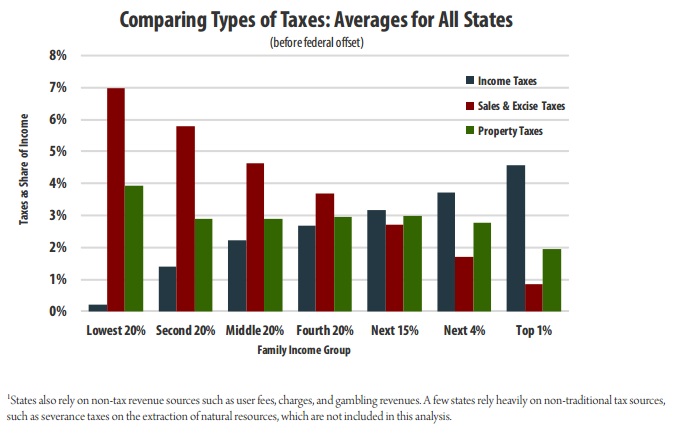
The tax system as a whole is largely regressive because the higher one’s class standing, the lower the proportion of total taxes they pay.  While the report provides great details in the variations across each state, the graph below shows that on average, the lowest 20% of earners pays an overall tax rate that is more than twice of what the top 1% of earners pay.

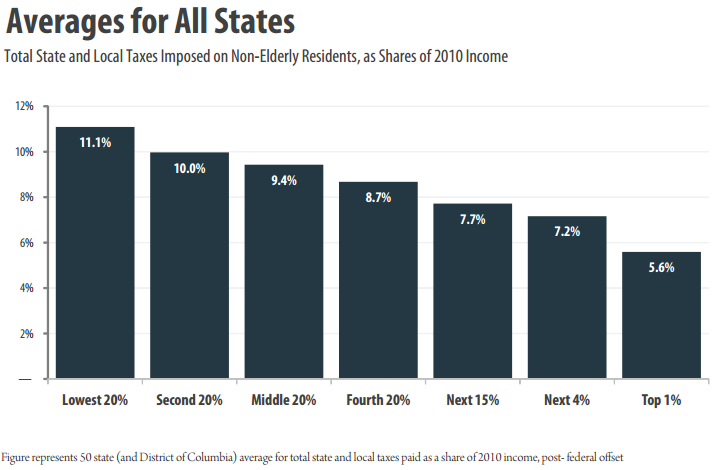
While many citizens perceive the U.S. tax code as inherently unfair because the wealthy have higher marginal rates on their federal income tax (the only one anyone ever seems to talk about); an examination of the entire system reveals the opposite as cumulatively, the poor pay a larger proportion of their income to local, state, and the federal governments.

—————————

Jason Eastman is an Assistant Professor of Sociology at Coastal Carolina University who researches how culture and identity influence social inequalities.

Cross-posted at Reports from the Economic Front.

The British economy is a disaster.  Oddly enough most analysts find it difficult to explain why.

Actually the reason is quite simple. The British government responded to its own Great Recession by cutting spending and raising taxes.  The result, which is anything but mysterious, is that the county remains in deep recession.

Matthew O’Brien, writing in The Atlantic, describes the situation as follows:

…public net investment — things like roads and bridges and schools,  and everything else the economy needs to grow — has fallen by half the past three years, and is set to fall even further the next two. It’s the economic equivalent of shooting yourself in both feet, just in case shooting yourself in one doesn’t completely cripple you. Austerity has driven down Britain’s borrowing costs even further, but that’s been due to investors losing faith in its recovery, rather than having more faith in its public finances. Indeed, weak growth has kept deficits from coming down all that much, despite the higher taxes and slower spending. In other words, it’s economic pain for no fiscal gain.

Below is a chart taken from The Atlantic article.  It shows that:

Britain’s stagnating economy has left it in worse shape at this point of its recovery than it was during the Great Depression. GDP is still more than 3 percent below its 2008 peak, and it hasn’t done anything to catchup in years. At this pace, there will be no recovery in our time, or any other time.

 gdp to december 2012

In other words, while the British economy suffered a deeper decline during the Great Depression period of 1930 to 1934 than to this point in the Great Recession which started in 2008, the economy recovered far more quickly then than now.  In fact, it doesn’t seem to be recovering now at all.

Perhaps the most surprising thing about the situation is that political leaders appear determined to stay the course.

Martin Hart-Landsberg is a professor of economics at Lewis and Clark College. You can follow him at Reports from the Economic Front.

Cross-posted at Montclair SocioBlog.

The Wall Street Journal had an op-ed this week by Donald Boudreaux and Mark Perry claiming that things are great for the middle class.  Here’s why:

No single measure of well-being is more informative or important than life expectancy. Happily, an American born today can expect to live approximately 79 years — a full five years longer than in 1980 and more than a decade longer than in 1950.

Yes, but.  If life-expectancy is the all-important measure of well-being, then we Americans are less well off than are people in many other countries, including Cuba.

The authors also claim that we’re better off because things are cheaper:

…spending by households on many of modern life’s “basics” — food at home, automobiles, clothing and footwear, household furnishings and equipment, and housing and utilities — fell from 53% of disposable income in 1950 to 44% in 1970 to 32% today.

Globalization probably has much to do with these lower costs.  But when I reread the list of “basics,” I noticed that a couple of items were missing, items less likely to be imported or outsourced, like housing and health care.  So, we’re spending less on food and clothes, but more on health care and houses. Take housing.  The median home values for childless couples increased by 26% between just 1984 and 2001 (inflation-adjusted); for married couples with children, who are competing to get into good school districts, median home value ballooned by 78% (source).

The authors also make the argument that technology reduces the consuming gap between the rich and the middle class.  There’s not much difference between the iPhone that I can buy and the one that Mitt Romney has.  True, but it says only that products filter down through the economic strata just as they always have.  The first ball-point pens cost as much as dinner for two in a fine restaurant.  But if we look forward, not back, we know that tomorrow the wealthy will be playing with some new toy most of us cannot afford. Then, in a few years, prices will come down, everyone will have one, and by that time the wealthy will have moved on to something else for us to envy.

The readers and editors of the Wall Street Journal may find comfort in hearing Boudreaux and Perry’s good news about the middle class.  Middle-class people themselves, however, may be a bit skeptical on being told that they’ve never had it so good (source).

Some of the people in the Gallup sample are not middle class, and they may contribute disproportionately to the pessimistic side.  But Boudreaux and Perry do not specify who they include as middle class.  But it’s the trend in the lines that is important.  Despite the iPhones, airline tickets, laptops and other consumer goods the authors mention, fewer people feel that they have enough money to live comfortably.

Boudreaux and Perry insist that the middle-class stagnation is a myth, though they also say that

The average hourly wage in real dollars has remained largely unchanged from at least 1964—when the Bureau of Labor Statistics (BLS) started reporting it.

Apparently“largely unchanged” is completely different from “stagnation.”  But, as even the mainstream media have reported, some incomes have changed quite a bit (source).

The top 10% and especially the top 1% have done well in this century.  The 90%, not so much. You don’t have to be too much of a Marxist to think that maybe the Wall Street Journal crowd has some ulterior motive in telling the middle class that all is well and getting better all the time.

—————————

Jay Livingston is the chair of the Sociology Department at Montclair State University.  You can follow him at Montclair SocioBlog or on Twitter.

The Institute of Medicine and the National Research Council released some damaging numbers this month: Americans ranks startlingly low in life expectancy, compared to 16 other similarly developed countries.  This is especially true for younger Americans. Indeed, among people 55 and under, we rank dead last.  Among those 50-80 years old, our life expectancy is 3rd or 2nd to last.

Sabrina Tavernise at the New York Times reports that the “major contributors” to low life expectancy among younger Americans are high rates of death from guns, car accidents, and drug overdoses.  We also have the highest rate of diabetes and the second-highest death rate from lung and heart disease.

Americans had “the lowest probability over all of surviving to the age of 50.”  The numbers for American men were slightly worse than those for women. Overall, life expectancy for men was 17 out of 17; women came in 16th.  Education and poverty made a difference too, as did the more generous social services provided by the other countries in the study.

What isn’t making a difference?  Apparently our incredible rate of health care spending.

Via Citings and Sightings.

Lisa Wade, PhD is an Associate Professor at Tulane University. She is the author of American Hookup, a book about college sexual culture; a textbook about gender; and a forthcoming introductory text: Terrible Magnificent Sociology. You can follow her on Twitter and Instagram.

Cross-posted at Reports from the Economic Front.

The media continues to direct our attention to deficits and debt as our main problems.  Yet, it does little to really highlight the causes of these deficits and debts.

The following two figures from the Center on Budget and Policy Priorities help to clarify the causes.  It is important to note that the projections underlying both figures were made before the recent vote making permanent most of the Bush-era tax cuts.

Figure 1 shows the main drivers of our large national deficits: the Bush-era tax cuts, the wars in Iraq and Afghanistan, and our economic crisis and responses to it.  Without those drivers our national deficits would have remained quite small.

10-10-12bud-f1

Figure 2 shows the main drivers of our national debt. Not surprisingly they are the same as the drivers of our deficits.

10-10-12bud-f2

Significantly, the same political leaders that scream the loudest about our deficits and debt have little to say about stopping the wars or reducing military spending and are the most adamant about maintaining the Bush-era tax cuts.  That is because, at root, their interest is in reducing spending on non-security programs rather than reducing the deficit or debt.

Some of these leaders argue that the tax cuts will help correct our economic problems and thereby help reduce the deficit and debt.  However, multiple studies have shown that tax cuts are among the least effective ways to stimulate employment and growth.  In contrast, the most effective are sustained and targeted government efforts to refashion economic activity by spending on green conversion, infrastructure, health care, education and the like.

While Republicans and Democrats debate the extent to which taxes should be raised, both sides appear to agree on the need to rein in federal government spending in order to achieve deficit reduction.  In fact, federal government spending has been declining both absolutely and, as the following figure from the St. Louis Federal Reserve shows, as a share of GDP.

government-spending-as-a-percent-of-gdp

In reality, our main challenge is not reducing our deficit or debt but rather strengthening our economy, and cutting government spending is not going to help us overcome that challenge.  As Peter Coy, writing in BusinessWeek explains:

It pains deficit hawks to hear this, but ever since the 2008 financial crisis, government red ink has been an elixir for the U.S. economy. After the crisis, households strove to pay down debt and businesses hoarded profits while skimping on investment. If the federal government had tried to run balanced budgets, there would have been an enormous economy wide deficit of demand and the economic slump would have been far worse. In 2009 fiscal policy added about 2.7 percentage points to what the economy’s growth rate would have been, according to calculations by Mark Zandi of Moody’s Analytics. But since then the U.S. has underutilized fiscal policy as a recession-fighting tool. The economic boost dropped to just half a percentage point in 2010. Fiscal policy subtracted from growth in 2011 and 2012 and will do so again in 2013, to the tune of about 1 percentage point, Zandi estimates.

or02_GDPChart_405

If we were serious about tackling our economic problems we would raise tax rates and close tax loopholes on the wealthy and corporations and reduce military spending, and then use a significant portion of the revenue generated to fund a meaningful government stimulus program.  That would be a win-win proposition as far as the economy and budget is concerned.

—————————

Martin Hart-Landsberg is a professor of Economics and Director of the Political Economy Program at Lewis and Clark College.  You can follow him at Reports from the Economic Front.

Cross-posted at Reports from the Economic Front.

Considering the enormous time spent debating tax policy, it is easy to imagine that the U.S. must have one of the high tax rates in the world.  Well, that is not the case.

The Atlantic has a great post which includes Business Insider graphs drawn from a KPMG report on global tax rates.

Here is one of them.  It shows the personal tax rate paid by people making the equivalent of $100,000 a year in 2012.  The U.S. is the 55th ranked country out of 114 in terms of tax rates.

tax rates ranking 100k (1)

The next graph shows the same thing but for those earning the equivalent of $300,000 a year.  The U.S. ranking is similar for this upper income group, 53rd highest out of 114.

tax rates world ranking 300k

 Moreover, as Derek Thompson, the author of the Atlantic post, notes:

But these numbers might understate how low taxes have been in the U.S. Unlike most advanced economies, the U.S. don’t supplement personal income taxes with a national sales tax, or value-added tax (VAT). Consumption taxes accounted for about a fifth of total U.S. revenue in 2008 (mostly at the state and local level) compared to an OECD average of 32 percent. In other words, the U.S. relies uniquely on personal tax rates to raise revenue — and we have relatively low personal tax rates.

Finally, here is a look at the U.S. ranking among OECD countries for taxes as a share of GDP in 2008.

The-Numbers-Jan-2012-International_1

So, given that the U.S. doesn’t seem to be a high-tax rate country, why is tax policy so contentious?  No doubt the answer has a lot to do with who actually pays the taxes and, perhaps even more importantly, what the revenue is used for.

—————————

Martin Hart-Landsberg is a professor of Economics and Director of the Political Economy Program at Lewis and Clark College.  You can follow him at Reports from the Economic Front.

As politicians negotiated regarding the fiscal cliff, they debated whether to cut social programs aimed at alleviating poverty and deprivation.  Most of us imagine that these programs help a minority of the population.  In fact, the Pew Research Center reports that more than half of the population has received government benefits from one of the six most well-known programs:

This isn’t the so-called 47% that Romney claimed would vote for a Democrat no matter what.  In fact, people who received one of these six benefits were only slightly more likely to vote Democratic:

In fact, receiving benefits is pretty well spread out among the population. Except for people over 65, there seems to be significant consistency in the receipt of at least one benefit:

Notably, these programs also go to help the poor, women (largely because they end up single with young children), and people in rural areas.

Interestingly, many of us who have benefited from targeted government programs (“targeted” because we all benefit from programs like, oh, transportation initiatives and environmental protection and [insert dozens more here]) don’t know that we do.  In a previous post, we showed that large proportions of people who’ve benefited from social programs don’t recognize that they have unless their thinking is sparked by asking them about specific programs.  (It’s kind of like responding “No I don’t do drugs” and then being asked specifically about marijuana and saying, “Oh yeah, well that one I guess!”).

Since it is indeed the majority of Americans who benefit from targeted programs, it shouldn’t be too hard for politicians to find it in their hearts to support these programs.  That 57% of conservatives and 52% of Republicans have used them suggests that the political right is more interested in purporting an ideology than serving its constituency.

Alternatively, they realize that a certain proportion of benefit recipients also believe that the government “does not have the responsibility to care for those who cannot care or themselves.” About a third of people who hold onto this principle have used benefits:

It seems that data like this might be very useful for what we really need: an educational campaign designed to help Americans understand what social programs do and who benefits from them.   Maybe then we could have sensible policy discussions.

Lisa Wade, PhD is an Associate Professor at Tulane University. She is the author of American Hookup, a book about college sexual culture; a textbook about gender; and a forthcoming introductory text: Terrible Magnificent Sociology. You can follow her on Twitter and Instagram.

Cross-posted at Reports from the Economic Front.

Many expected that the severity of the Great Recession, a recognition that prior expansion was largely based on unsustainable “bubbles,” and an anemic post-crisis recovery, would lead to serious discussion about the need to transform our economy.   Yet, it hasn’t happened.

One important reason is that not everyone has experienced the Great Recession and its aftermath the same. Jordan Weissmann, writing in the Atlantic, published a figure from the work of Edward Wolff. The charts shows the rise and fall of median and mean net worth among Americans: how much one owns (e.g., savings, investments, and property) minus how much one owes (e.g., credit card debt and outstanding loans).

Both the mean and the median are interesting because, while they’re both measures of central tendency, one is more sensitive to extremes than the other. The mean is the statistical average (literally, all the numbers added up and divided by the number of numbers), so it is influenced by very low and very high numbers.  The median, in contrast is, literally, the number in the middle of the sample of numbers.  So, if there are very high or low numbers, their status as outliers doesn’t shape the measure.

Back to the figure: as of 2010, median household net worth (dark purple) had fallen back to levels last seen in the early 1960s.  In contrast, mean household net worth (light purple) had only retreated to the 2000s.  This shows that a small number of outliers — the very, very rich — have weathered the Great Recession much better than the rest of us.

Wolff_Mean_and_Median_Net_Wealth-thumb-615x433-106876

The great disparity between median and mean wealth declines is a reflection of the ability of those at the top of the wealth distribution to maintain most of their past gains.  And the lack of discussion about the need for change in our economic system is largely a reflection of the ability of those very same people to influence our political leaders and shape our policy choices.

—————————

Martin Hart-Landsberg is a professor of Economics and Director of the Political Economy Program at Lewis and Clark College.  You can follow him at Reports from the Economic Front.