Last week CNN triumphantly reported that the job market has recovered to its 2008 peak. Here’s the headline:
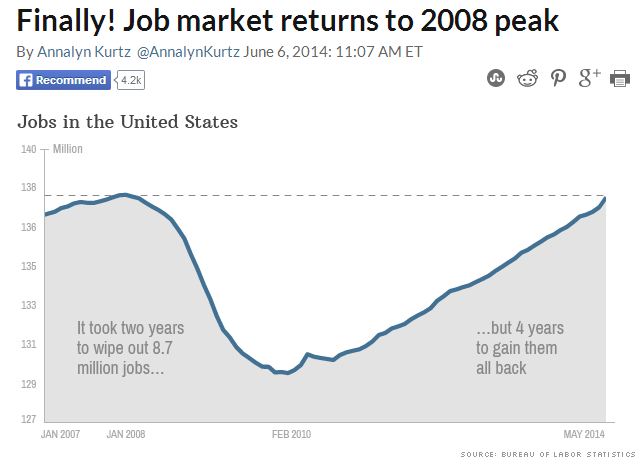
Not so fast, though.
Sociologist Philip Cohen observes that the real news is hidden in the fourth paragraph. There the author of the piece acknowledges that the job data are numbers, not proportions. The numbers have bounced back but, because of the addition of almost 12 million people to the U.S. population, the percent of Americans who have jobs or are in school remains lower than it was in 2008.
From CNN:
Given population growth over the last four years, the economy still needs more jobs to truly return to a healthy place. How many more? A whopping 7 million, calculates Heidi Shierholz, an economist with the Economic Policy Institute.
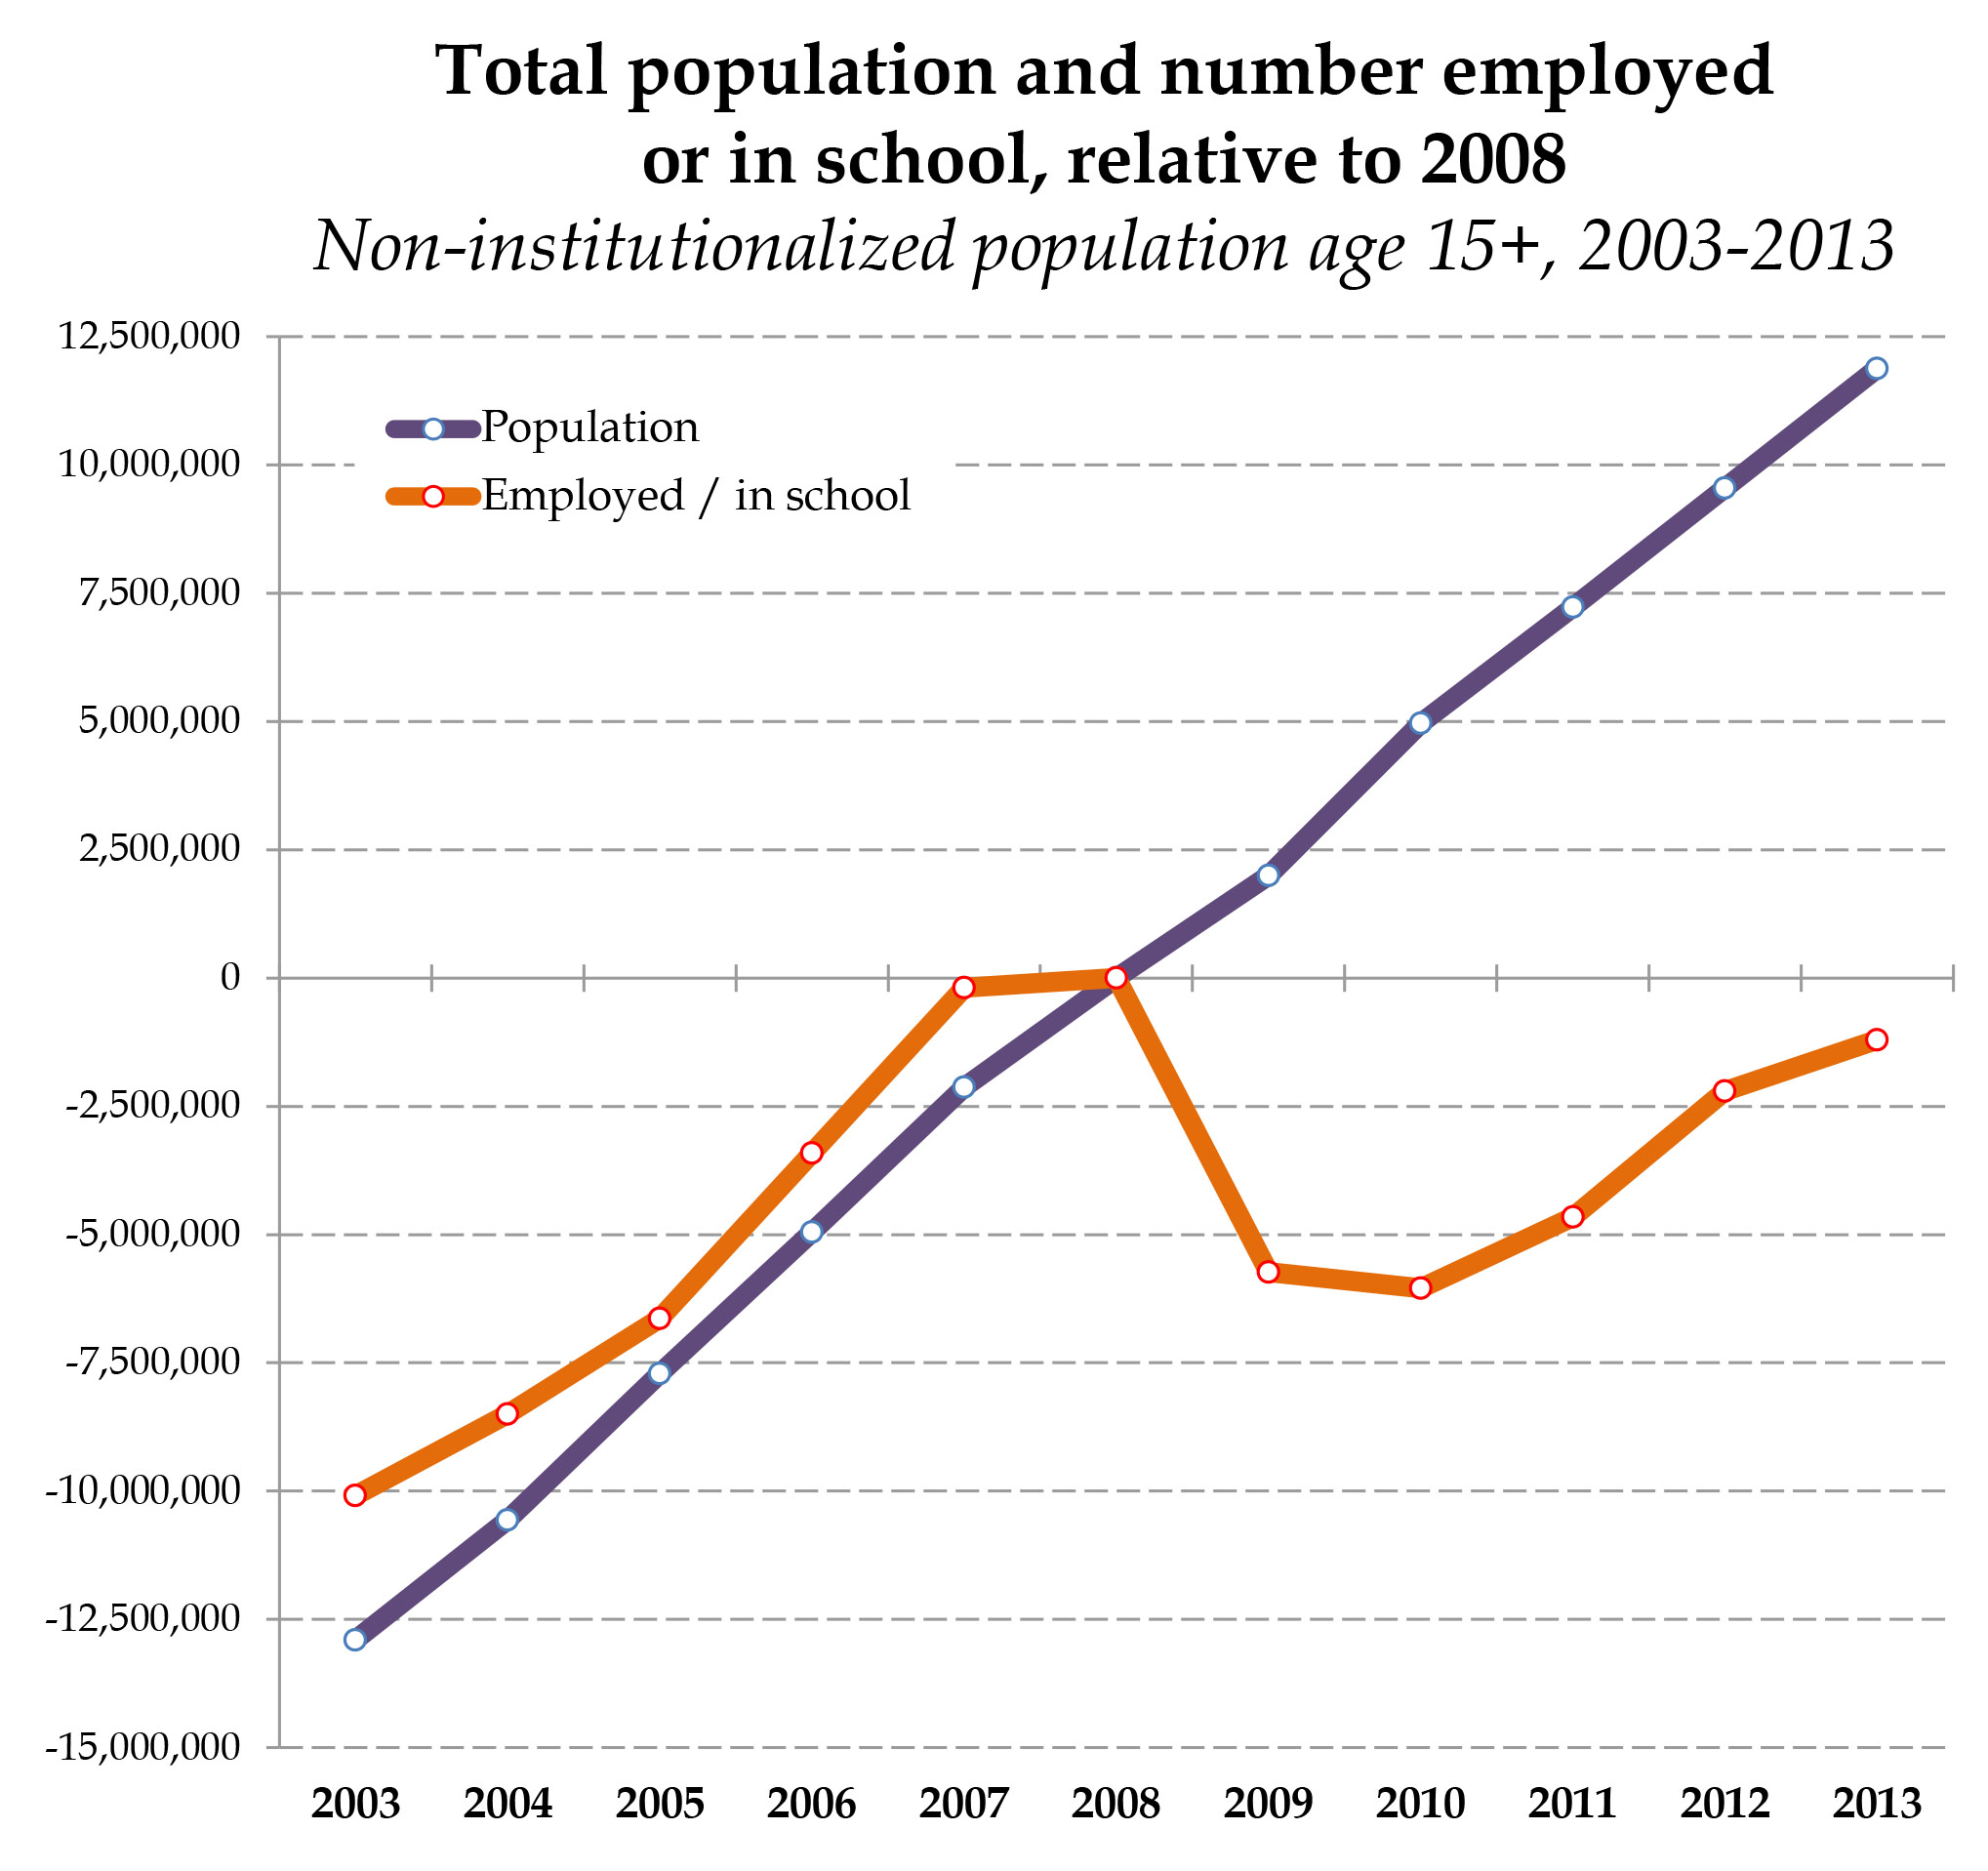
Using the Bureau of Labor Statistics, Cohen offers us a clearer look at where we’re at:
Lisa Wade, PhD is an Associate Professor at Tulane University. She is the author of American Hookup, a book about college sexual culture; a textbook about gender; and a forthcoming introductory text: Terrible Magnificent Sociology. You can follow her on Twitter and Instagram.