crime/law

The recent controversial arrests at a Philadelphia Starbucks, where a manager called the police on two Black men who had only been in the store a few minutes, are an important reminder that bias in the American criminal justice system creates both large scale, dramatic disparities and little, everyday inequalities. Research shows that common misdemeanors are a big part of this, because fines and fees can pile up on people who are more likely to be policed for small infractions.

A great example is the common traffic ticket. Some drivers who get pulled over get a ticket, while others get let off with a warning. Does that discretion shake out differently depending on the driver’s race? The Stanford Open Policing Project has collected data on over 60 million traffic stops, and a working paper from the project finds that Black and Hispanic drivers are more likely to be ticketed or searched at a stop than white drivers.

To see some of these patterns in a quick exercise, we pulled the project’s data on over four million stop records from Illinois and over eight million records from South Carolina. These charts are only a first look—we split the recorded outcomes of stops across the different codes for driver race available in the data and didn’t control for additional factors. However, they give a troubling basic picture about who gets a ticket and who drives away with a warning.

(Click to Enlarge)
(Click to Enlarge)

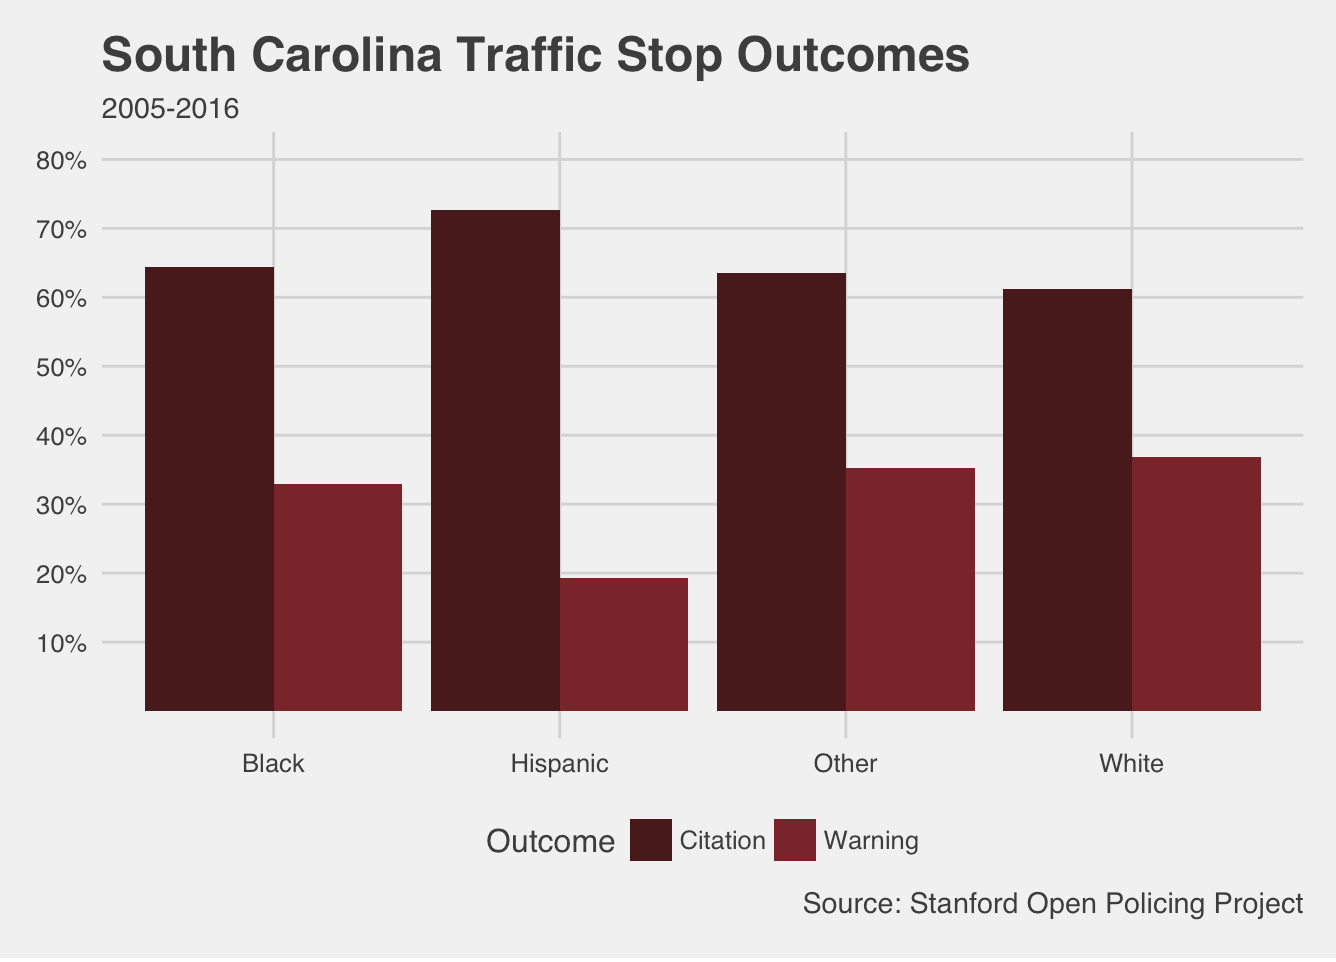
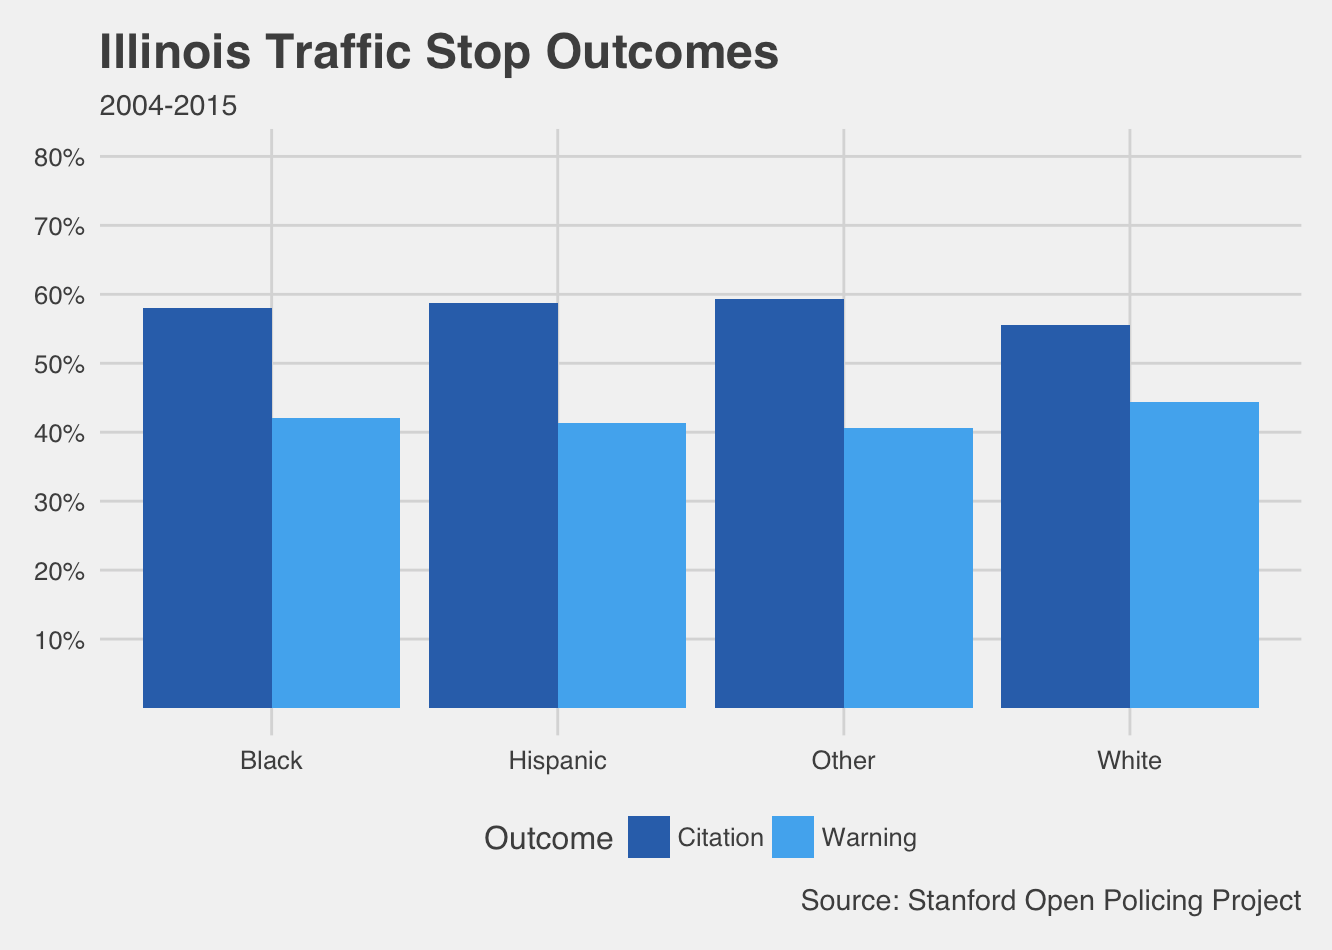
These charts show more dramatic disparities in South Carolina, but a larger proportion of white drivers who were stopped got off with warnings (and fewer got tickets) in Illinois as well. In fact, with millions of observations in each data set, differences of even a few percentage points can represent hundreds, even thousands of drivers. Think about how much revenue those tickets bring in, and who has to pay them. In the criminal justice system, the little things can add up quickly.

The Washington Post has been collecting data on documented fatal police shootings of civilians since 2015, and they recently released an update to the data set with incidents through the beginning of 2018. Over at Sociology Toolbox, Todd Beer has a great summary of the data set and a number of charts on how these shootings break down by race.

One of the main policy reforms suggested to address this problem is body cameras—the idea being that video evidence will reduce the number of killings by monitoring police behavior. Of course, not all police departments implement these cameras and their impact may be quite small. One small way to address these problems is public visibility and pressure.

So, how often are body cameras incorporated into incident reporting? Not that often, it turns out. I looked at all the shootings of unarmed civilians in The Washington Post’s dataset, flagging the ones where news reports indicated a body camera was in use. The measure isn’t perfect, but it lends some important context.

(Click to Enlarge)

Body cameras were only logged in 37 of 219 cases—about 17% of the time—and a log doesn’t necessarily mean the camera present was even recording. Sociologists know that organizations are often slow to implement new policies, and they don’t often just bend to public pressure. But there also hasn’t been a change in the reporting of body cameras, and this highlights another potential stumbling block as we track efforts for police reform.

Evan Stewart is an assistant professor of sociology at University of Massachusetts Boston. You can follow his work at his website, on Twitter, or on BlueSky.

Over at Family Inequality, Phil Cohen has a list of demographic facts you should know cold. They include basic figures like the US population (326 million), and how many Americans have a BA or higher (30%). These got me thinking—if we want to have smarter conversations and fight fake news, it is also helpful to know which way things are moving. “What’s Trending?” is a post series at Sociological Images with quick looks at what’s up, what’s down, and what sociologists have to say about it.

The Crime Drop

You may have heard about a recent spike in the murder rate across major U.S. cities last year. It was a key talking point for the Trump campaign on policing policy, but it also may be leveling off. Social scientists can also help put this bounce into context, because violent and property crimes in the U.S. have been going down for the past twenty years.

You can read more on the social sources of this drop in a feature post at The Society Pages. Neighborhood safety is a serious issue, but the data on crime rates doesn’t always support the drama.

Evan Stewart is an assistant professor of sociology at University of Massachusetts Boston. You can follow his work at his website, on Twitter, or on BlueSky.

Originally posted at Scatterplot.

There has been a lot of great discussion, research, and reporting on the promise and pitfalls of algorithmic decisionmaking in the past few years. As Cathy O’Neil nicely shows in her Weapons of Math Destruction (and associated columns), algorithmic decisionmaking has become increasingly important in domains as diverse as credit, insurance, education, and criminal justice. The algorithms O’Neil studies are characterized by their opacity, their scale, and their capacity to damage.

Much of the public debate has focused on a class of algorithms employed in criminal justice, especially in sentencing and parole decisions. As scholars like Bernard Harcourt and Jonathan Simon have noted, criminal justice has been a testing ground for algorithmic decisionmaking since the early 20th century. But most of these early efforts had limited reach (low scale), and they were often published in scholarly venues (low opacity). Modern algorithms are proprietary, and are increasingly employed to decide the sentences or parole decisions for entire states.

“Code of Silence,” Rebecca Wexler’s new piece in Washington Monthlyexplores one such influential algorithm: COMPAS (also the study of an extensive, if contested, ProPublica report). Like O’Neil, Wexler focuses on the problem of opacity. The COMPAS algorithm is owned by a for-profit company, Northpointe, and the details of the algorithm are protected by trade secret law. The problems here are both obvious and massive, as Wexler documents.

Beyond the issue of secrecy, though, one issue struck me in reading Wexler’s account. One of the main justifications for a tool like COMPAS is that it reduces subjectivity in decisionmaking. The problems here are real: we know that decisionmakers at every point in the criminal justice system treat white and black individuals differently, from who gets stopped and frisked to who receives the death penalty. Complex, secretive algorithms like COMPAS are supposed to help solve this problem by turning the process of making consequential decisions into a mechanically objective one – no subjectivity, no bias.

But as Wexler’s reporting shows, some of the variables that COMPAS considers (and apparently considers quite strongly) are just as subjective as the process it was designed to replace. Questions like:

Based on the screener’s observations, is this person a suspected or admitted gang member?

In your neighborhood, have some of your friends or family been crime victims?

How often do you have barely enough money to get by?

Wexler reports on the case of Glenn Rodríguez, a model inmate who was denied parole on the basis of his puzzlingly high COMPAS score:

Glenn Rodríguez had managed to work around this problem and show not only the presence of the error, but also its significance. He had been in prison so long, he later explained to me, that he knew inmates with similar backgrounds who were willing to let him see their COMPAS results. “This one guy, everything was the same except question 19,” he said. “I thought, this one answer is changing everything for me.” Then another inmate with a “yes” for that question was reassessed, and the single input switched to “no.” His final score dropped on a ten-point scale from 8 to 1. This was no red herring.

So what is question 19? The New York State version of COMPAS uses two separate inputs to evaluate prison misconduct. One is the inmate’s official disciplinary record. The other is question 19, which asks the evaluator, “Does this person appear to have notable disciplinary issues?”

Advocates of predictive models for criminal justice use often argue that computer systems can be more objective and transparent than human decisionmakers. But New York’s use of COMPAS for parole decisions shows that the opposite is also possible. An inmate’s disciplinary record can reflect past biases in the prison’s procedures, as when guards single out certain inmates or racial groups for harsh treatment. And question 19 explicitly asks for an evaluator’s opinion. The system can actually end up compounding and obscuring subjectivity.

This story was all too familiar to me from Emily Bosk’s work on similar decisionmaking systems in the child welfare system where case workers must answer similarly subjective questions about parental behaviors and problems in order to produce a seemingly objective score used to make decisions about removing children from home in cases of abuse and neglect. A statistical scoring system that takes subjective inputs (and it’s hard to imagine one that doesn’t) can’t produce a perfectly objective decision. To put it differently: this sort of algorithmic decisionmaking replaces your biases with someone else’s biases.

Dan Hirschman is a professor of sociology at Brown University. He writes for scatterplot and is an editor of the ASA blog Work in Progress. You can follow him on Twitter.

Human beings are prone to a cognitive bias called the Law of the Instrument. It’s the tendency to see everything as being malleable according to whatever tool you’re used to using. In other words, if you have a hammer, suddenly all the world’s problems look like nails to you.

Objects humans encounter, then, aren’t simply useful to them, or instrumental; they are transformative: they change our view of the world. Hammers do. And so do guns. “You are different with a gun in your hand,” wrote the philosopher Bruno Latour, “the gun is different with you holding it. You are another subject because you hold the gun; the gun is another object because it has entered into a relationship with you.”

In that case, what is the effect of transferring military grade equipment to police officers?

In 1996, the federal government passed a law giving the military permission to donate excess equipment to local police departments. Starting in 1998, millions of dollars worth of equipment was transferred each year. Then, after 9/11, there was a huge increase in transfers. In 2014, they amounted to the equivalent of 796.8 million dollars.

Image via The Washington Post:

Those concerned about police violence worried that police officers in possession of military equipment would be more likely to use violence against civilians, and new research suggests that they’re right.

Political scientist Casey Delehanty and his colleagues compared the number of civilians killed by police with the monetary value of transferred military equipment across 455 counties in four states. Controlling for other factors (e.g., race, poverty, drug use), they found that killings rose along with increasing transfers. In the case of the county that received the largest transfer of military equipment, killings more than doubled.

But maybe they got it wrong? High levels of military equipment transfers could be going to counties with rising levels of violence, such that it was increasingly violent confrontations that caused the transfers, not the transfers causing the confrontations.

Delehanty and his colleagues controlled for the possibility that they were pointing the causal arrow the wrong way by looking at the killings of dogs by police. Police forces wouldn’t receive military equipment transfers in response to an increase in violence by dogs, but if the police were becoming more violent as a response to having military equipment, we might expect more dogs to die. And they did.

Combined with research showing that police who use military equipment are more likely to be attacked themselves, literally everyone will be safer if we reduce transfers and remove military equipment from the police arsenal.

Lisa Wade, PhD is an Associate Professor at Tulane University. She is the author of American Hookup, a book about college sexual culture; a textbook about gender; and a forthcoming introductory text: Terrible Magnificent Sociology. You can follow her on Twitter and Instagram.

Originally posted at Gin & Tacos.

If you want to feel old, teach. That movie quote is not wrong: You get older, the students stay the same age.

Your cultural references are all dated, even when you think things are recent (ex., The Wire is already ancient history. You might as well reference the Marx Brothers). You reference major historical events that they’ve sort-of heard of but know essentially nothing about (ex. the Cold War, Vietnam, the OJ Simpson trial, etc.) You do the math and realize that they were 3 when 9-11 happened. And of course it only gets worse with time. You get used to it.

One of the saddest moments I ever had in a classroom, though, involved Rodney King and the LA Riots. We just passed the 25th anniversary of those events that left such a mark on everyone who lived through them. Of course “25th Anniversary” is a bold warning that students, both college and K-12, will have only the vaguest sense of what the proper nouns refer to. A few semesters ago in reference to the Michael Brown / Ferguson incident I mentioned Rodney King in an Intro to American Government class. I got the blank “Is that a thing we are supposed to know?” look that I have come to recognize when students hear about something that happened more than six months ago. “Rodney King?” More blinking. “Can someone tell why the name Rodney King is important?”

One student, god bless her, raised her hand. I paraphrase: “He was killed by the police and it caused the LA Riots.” I noted that, no, he did not die, but the second part of the statement was indirectly true. God bless technology in the classroom – I pulled up the grainy VHS-camcorder version of the video, as well as a transcript of the audio analysis presented at trial. We watched, and then talked a bit about the rioting following the acquittal of the LAPD officers at trial. They kept doing the blinking thing. I struggled to figure out what part of this relatively straightforward explanation had managed to confuse them.

“Are there questions? You guys look confused.”

Hand. “So he was OK?”

“He was beaten up pretty badly, but, ultimately he was. He died a few years ago from unrelated causes (note: in 2012).”

Hand. “It’s kind of weird that everybody rioted over that. I mean, there’s way worse videos.” General murmurs of agreement.

“Bear in mind that this was pre-smartphone. People heard rumors, but it this was the first instance of the whole country actually seeing something like this as it happened. A bystander just happened to have a camcorder.” Brief explanation, to general amusement, of what an Old Fashioned camcorder looked like. Big, bulky, tape-based. 18-year-olds do not know this.

I do believe they all understood, but as that day went on I was increasingly bothered by that that brief exchange meant. This is a generation of kids so numb to seeing videos of police beating, tasering, shooting, and otherwise applying the power of the state to unarmed and almost inevitably black or Hispanic men that they legitimately could not understand why a video of cops beating up a black guy (who *didn’t even die* for pete’s sake!) was shocking enough to cause a widespread breakdown of public order. Now we get a new video every week – sometimes every few days – to the point that the name of the person on the receiving end is forgotten almost immediately. There are too many “Video of black guy being shot or beaten” videos for even interested parties to keep them all straight. Do a self test. Do you remember the name of the guy the NYPD choked out for selling loose cigarettes? The guy in suburban Minneapolis whose girlfriend posted a live video on Facebook after a cop shot her boyfriend in the car? The guy in Tulsa who was surrounded by cops and unarmed while a police helicopter recorded an officer deciding to shoot him? The woman who was found hanged in her Texas jail cell leading to the public pleas to “Say Her Name”?

These kids have grown up in a world where this is background noise. It is part of the static of life in the United States. Whether these incidents outrage them or are met with the usual excuses (Comply faster, dress differently, be less Scary) the fact is that they happen so regularly that retaining even one of them in long term memory is unlikely. To think about Rodney King is to imagine a reality in which it was actually kind of shocking to see a video of four cops kicking and night-sticking an unarmed black man over the head repeatedly. Now videos of police violence are about as surprising and rare as weather reports, and forgotten almost as quickly once passed.

Ed is an assistant professor in the Department of Political Science at Midwestern Liberal Arts University. He writes about politics at Gin & Tacos.

Originally posted at Montclair Socioblog.

Does crime go up when cops, turtle-like, withdraw into their patrol cars, when they abandon “proactive policing” and respond only when called?

In New York we had the opportunity to test this with a natural experiment. Angry at the mayor, the NYPD drastically cut back on proactive policing starting in early December of 2014. The slowdown lasted through early January. This change in policing – less proactive, more reactive – gave researchers Christopher Sullivan and Zachary O’Keeffe an opportunity to look for an effect. (Fair warning: I do not know if their work has been published yet in any peer-reviewed journal.)

First, they confirmed that cops had indeed cut back on enforcing minor offenses. In the graphs below, the yellow shows the rate of enforcement in the previous year (July 2013 to July 2014) when New York cops were not quite so angry at the mayor. The orange line shows the next year. The cutback in enforcement is clear. The orange line dips drastically; the police really did stop making arrests for quality-of-life offenses.

.

Note also that even after the big dip, enforcement levels for the rest of the year remained below those of the previous year, especially in non-White neighborhoods.Sullivan and O’Keeffe also looked at reported crime to see if the decreased enforcement had emboldened the bad guys. The dark blue line shows rates for the year that included the police cutback; the light blue line shows the previous year.

 .

No effect. The crime rates in those winter weeks of reduced policing and after look very much like the crime rates of the year before.

It may be that a few weeks is not enough time for a change in policing to affect serious crime. Certainly, proponents of proactive policing would argue that what attracts predatory criminals to an area is not a low number of arrests but rather the overall sense that this is a place were bad behavior goes unrestrained. Changing the overall character of a neighborhood – for better or worse – takes more than a few weeks.

I have the impression that many people, when they think about crime, use a sort of cops-and-robbers model: cops prevent crime and catch criminals; the more active the cops, the less active the criminals. There may be some truth in that model but, if nothing else, the New York data shows that the connection between policing and crime is not so immediate or direct.

Jay Livingston is the chair of the Sociology Department at Montclair State University. You can follow him at Montclair SocioBlog or on Twitter.

Facts about all manner of things have made headlines recently as the Trump administration continues to make statements, reports, and policies at odds with things we know to be true. Whether it’s about the size of his inauguration crowd, patently false and fear-mongering inaccuracies about transgender persons in bathrooms, rates of violent crime in the U.S., or anything else, lately it feels like the facts don’t seem to matter. The inaccuracies and misinformation continue despite the earnest attempts of so many to correct each falsehood after it is made.  It’s exhausting. But why is it happening?

Many of the inaccuracies seem like they ought to be easy enough to challenge as data simply don’t support the statements made. Consider the following charts documenting the violent crime rate and property crime rate in the U.S. over the last quarter century (measured by the Bureau of Justice Statistics). The overall trends are unmistakable: crime in the U.S. has been declining for a quarter of a century.

Now compare the crime rate with public perceptions of the crime rate collected by Gallup (below). While the crime rate is going down, the majority of the American public seems to think that crime has been getting worse every year. If crime is going down, why do so many people seem to feel that there is more crime today than there was a year ago?  It’s simply not true.

There is more than one reason this is happening. But, one reason I think the alternative facts industry has been so effective has to do with a concept social scientists call the “backfire effect.” As a rule, misinformed people do not change their minds once they have been presented with facts that challenge their beliefs. But, beyond simply not changing their minds when they should, research shows that they are likely to become more attached to their mistaken beliefs. The factual information “backfires.” When people don’t agree with you, research suggests that bringing in facts to support your case might actually make them believe you less. In other words, fighting the ill-informed with facts is like fighting a grease fire with water. It seems like it should work, but it’s actually going to make things worse.

To study this, Brendan Nyhan and Jason Reifler (2010) conducted a series of experiments. They had groups of participants read newspaper articles that included statements from politicians that supported some widespread piece of misinformation. Some of the participants read articles that included corrective information that immediately followed the inaccurate statement from the political figure, while others did not read articles containing corrective information at all.

Afterward, they were asked a series of questions about the article and their personal opinions about the issue. Nyhan and Reifler found that how people responded to the factual corrections in the articles they read varied systematically by how ideologically committed they already were to the beliefs that such facts supported. Among those who believed the popular misinformation in the first place, more information and actual facts challenging those beliefs did not cause a change of opinion—in fact, it often had the effect of strengthening those ideologically grounded beliefs.

It’s a sociological issue we ought to care about a great deal right now. How are we to correct misinformation if the very act of informing some people causes them to redouble their dedication to believing things that are not true?

Tristan Bridges, PhD is a professor at the University of California, Santa Barbara. He is the co-editor of Exploring Masculinities: Identity, Inequality, Inequality, and Change with C.J. Pascoe and studies gender and sexual identity and inequality. You can follow him on Twitter here. Tristan also blogs regularly at Inequality by (Interior) Design.