age/aging

Cross-posted at Family Inequality.

The other day I was surprised that a group of reporters failed to call out what seemed to be an obvious exaggeration by Republican Congresspeople in a press conference. Did the reporters not realize that a 25% unemployment rate among college graduates in 2013 is implausible, were they not paying attention, or do they just assume they’re being fed lies all the time so they don’t bother?

Last semester I launched an aggressive campaign to teach the undergraduate students in my class the size of the US population. If you don’t know that – and some large portion of them didn’t – how can you interpret statements such as, “On average, 24 people per minute are victims of rape, physical violence, or stalking by an intimate partner in the United States.” In this case the source followed up with, “Over the course of a year, that equals more than 12 million women and men.” But, is that a lot? It’s a lot more in the United States than it would be in China. (Unless you go with, “any rape is too many,” in which case why use a number at all?)

1

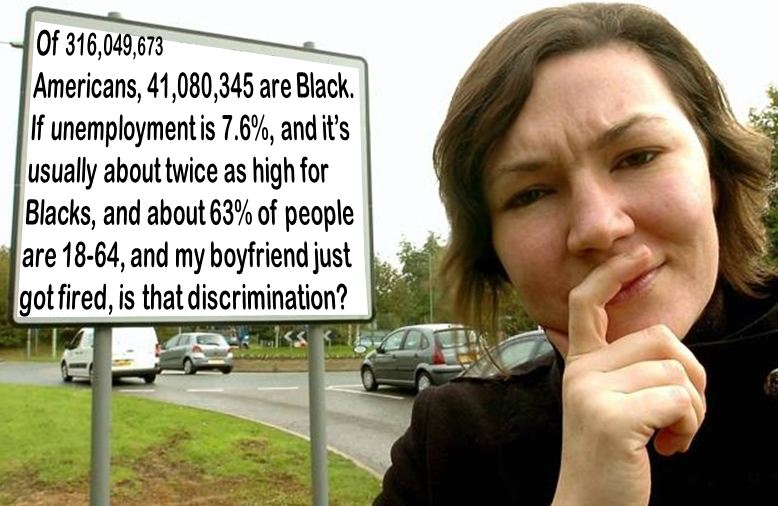
Anyway, just the US population isn’t enough. I decided to start a list of current demographic facts you need to know just to get through the day without being grossly misled or misinformed – or, in the case of journalists or teachers or social scientists, not to allow your audience to be grossly misled or misinformed. Not trivia that makes a point or statistics that are shocking, but the non-sensational information you need to know to make sense of those things when other people use them. And it’s really a ballpark requirement; when I tested the undergraduates, I gave them credit if they were within 20% of the US population – that’s anywhere between 250 million and 380 million!

I only got as far as 22 facts, but they should probably be somewhere in any top-100. And the silent reporters the other day made me realize I can’t let the perfect be the enemy of the good here. I’m open to suggestions for others (or other lists if they’re out there).

They refer to the US unless otherwise noted:

Description Number Source
World Population 7 billion 1
US Population 316 million 1
Children under 18 as share of pop. 24% 2
Adults 65+ as share of pop. 13% 2
Unemployment rate 7.6% 3
Unemployment rate range, 1970-2013 4% – 11% 4
Non-Hispanic Whites as share of pop. 63% 2
Blacks as share of pop. 13% 2
Hispanics as share of pop. 17% 2
Asians as share of pop. 5% 2
American Indians as share of pop. 1% 2
Immigrants as share of pop 13% 2
Adults with BA or higher 28% 2
Median household income $53,000 2
Most populous country, China 1.3 billion 5
2nd most populous country, India 1.2 billion 5
3rd most populous country, USA 315 million 5
4th most populous country, Indonesia 250 million 5
5th most populous country, Brazil 200 million 5
Male life expectancy at birth 76 6
Female life expectancy at birth 81 6
National life expectancy range 49 – 84 7

Sources:
1. http://www.census.gov/main/www/popclock.html
2. http://quickfacts.census.gov/qfd/states/00000.html
3. http://www.bls.gov/
4. Google public data: http://bit.ly/UVmeS3
5. https://www.cia.gov/library/publications/the-world-factbook/rankorder/2119rank.html
6. http://www.cdc.gov/nchs/hus/contents2011.htm#021
7. https://www.cia.gov/library/publications/the-world-factbook/rankorder/2102rank.html

Philip N. Cohen is a professor of sociology at the University of Maryland, College Park, and writes the blog Family Inequality. You can follow him on Twitter or Facebook.

Robb S. sent along a great set of images from Vulture.  Using case studies of individual leading men in Hollywood, they show that the love interests cast in their films don’t age alongside them over the course of their careers.  Not convinced?  Here’s nine examples and one exception.  For fun, try to guess which leading man bucks the trend?  I’ll embed it last.

1 2 3 4 5 6 7 8 9
And the exception is!
10

Lisa Wade, PhD is an Associate Professor at Tulane University. She is the author of American Hookup, a book about college sexual culture; a textbook about gender; and a forthcoming introductory text: Terrible Magnificent Sociology. You can follow her on Twitter and Instagram.

Cross-posted at Montclair Socioblog.

We got another reminder last week that despite complaints about federal government programs that give money to the poor, when it comes to taxes, the government is much more generous to the wealthy.  The news came from a report from the Congressional Budget Office on tax expenditures.

These are the ways that the government uses the tax system to give money to people. Some expenditures are tax credits, which can take the form of cash payments.  Others are tax breaks — taxing people less than the going rate. For example, if I am in the 35% tax bracket, but the government charges me only 15% on the $100,000 I made playing the stock market, the government is giving me $20,000 it could otherwise have had me pay in taxes. That’s an expense. The preferential rate for my luck in the market costs the government $20,000.

The justification for these expenditures is that they are a way the government can encourage people to do something that it wants them to do.  With tax breaks, the government is basically paying people by not charging them full tax fare — encouraging them to buy a house or give to charity or get health insurance at their work.  Similarly with the tax credits that go mostly to the poor. We want people to hold a job and to care for their kids.  The child tax credit gives people more money to care for their children.  The Earned Income Tax Credit pays them for working, even at jobs that pay very little.  By the same logic, the government is paying me to invest my money in companies — or put another way, to play the stock market.

This government largesse, however, benefits some people more than others:

1

About half of all tax expenditures go to the top quintile (top 20% of income earners).  The bottom 80% of earners divide the other half.  And within that richest quintile, the top 1% receive 15% of all tax expenditures (this distribution of tax breaks roughly parallels the distribution of income). Were you really expecting Sherwood Forest?

Here is a breakdown of the costs of these different tax expenditures:

2

The Earned Income Tax Credit, which benefits mostly the poor, costs less than $40B.  The tab for the low tax on investment income (capital gains and dividends) is more than twice that, and nearly all of that goes to the top quintile.  More than two-thirds goes to the richest 1%.

Dylan Matthews at the Washington Post WonkBlog regraphed the numbers to show the total amounts overall plus the amounts in each category for each income group:

3

The point? People complain about government payments to the poor, but tax breaks are also payments, though less obviously so, to the rich.  And those tax breaks cost the government a lot more money.

Jay Livingston is the chair of the Sociology Department at Montclair State University. You can follow him at Montclair SocioBlog or on Twitter.

Here’s an interesting new wrinkle in the data on support for same sex marriage.  According to Gallup, 53% of Americans now favor such marriages, but we don’t necessarily think other people do.  Overall, Americans, on average, think that 63% of their fellow citizens oppose same sex marriage; in fact, 45% do.  That’s an over-estimate of 18 percentage points!

2

Interestingly, Americans of all stripes — Democrat and Republican, liberal and conservative, old and young — underestimate support for same sex marriage.  Liberals come the closest, thinking that 48% approve; conservatives are the farthest off, thinking that only 16% do.

This data resonates with the recent finding that both Democratic and Republican politicians underestimate their constituents’ progressiveness.  I suspect that these misconceptions may make politicians wary about pressing for progressive policies; I wonder how similar misconceptions among the voting public might shape the pace and trajectory of social change.

h/t @tylerkingkade. Cross-posted at Pacific Standard.

Lisa Wade, PhD is an Associate Professor at Tulane University. She is the author of American Hookup, a book about college sexual culture; a textbook about gender; and a forthcoming introductory text: Terrible Magnificent Sociology. You can follow her on Twitter and Instagram.

Cross-posted at PolicyMic, Huffington Post, BlogHer, and Pacific Standard.

Writer Peg Streep is writing a book about the Millennial generation and she routinely sprinkles great data into her posts at Psychology Today.  

Recently she linked to at study by Net Impact that surveyed currently-enrolled college students and college-graduates across three generations Millennials, Gen Xers, and Baby Boomers.  The questions focused on life goals and work priorities.  They found significant differences between students and college grads, as well as interesting generational differences.

First, students have generally higher demands on the world; they are as likely or more likely than workers to say that a wide range of accomplishments are “important or essential to [their] happiness”:

In particular, students are more likely than workers to say it is important or essential to have a prestigious career with which they can make an impact.  More than a third think that this will happen within the next five years:

Wealth is less important to students than prestige and impact.  Over a third say they would take a significant pay cut to work for a company committed to corporate social responsibility (CSR), almost half for a company that makes a positive social or environmental impact, and over half to align their values with their job:

Students stand out, then, in both the desire to be personally successful and to make a positive contribution to society.

At the same time, they’re cynical about other people’s priorities.  Students and Millennials are far more likely than Gen Xers or Boomers to think that “people are just looking out for themselves.”

This data rings true to this college professor.  Despite the recession, the students at my (rather elite, private, liberal arts) school surprise me with their high professional expectations (thinking that they should be wildly successful, even if they’re worried they won’t be) and their desire to change the world (many strongly identify as progressives who are concerned with social inequalities and political corruption).

Some call this entitlement, but I think it’s at least as true to say that today’s college youth (the self-esteem generation) have been promised these things.  They’ve always been told to dream big, and so they do.  Unfortunately, I’m afraid that we’ve sold our young people a bill of goods.  Their high expectations sound like a recipe for disappointment, even for my privileged population, especially if they expect it to happen before they exit their twenties!

Alternatively, what we’re seeing is the idealism of youth.  It will be interesting to see if they downshift their expectations once they get into the workforce.  Net Impact doesn’t address whether these are largely generational or age differences.  It’s probably a combination of both.

Lisa Wade, PhD is an Associate Professor at Tulane University. She is the author of American Hookup, a book about college sexual culture; a textbook about gender; and a forthcoming introductory text: Terrible Magnificent Sociology. You can follow her on Twitter and Instagram.

Cross-posted at Montclair SocioBlog.

Jeb Bush told CPAC that the Republican party had an image problem.

Way too many people believe that Republicans are anti-immigrant, anti-woman, anti-science, anti-gay, anti-worker.

People have good reason to believe those things.  But the “way too many” suggests that the GOP’s problem is not image or brand, it’s demography.  For five years or longer, the Republican faithful have been complaining that “their” country was being taken away from them, and they were going to take it back (e.g., see my “Repo Men” post).

They were right.  Their country, a country dominated by older white men, is fading in the demographic tide.  The groups whose numbers in the electorate are on the rise don’t look like them.  Andrew Gelman (here) recently published these graphs as an update to his 2009 Red State, Blue State.  They reveal the tendency for different groups to vote more Democratic (blue) and Republican (red):

1

(The exit poll the data are based on sampled only in the 30 most competitive state. Texas and Georgia are large, and they have significant non-White populations. But demographic changes there are unlikely to have much effect on which party gets their electoral votes.)

Unfortunately for the GOP, the non-White proportion of the electorate will continue to grow. The female proportion may also increase, especially as education levels of women rise (more educated people are more likely to vote than are the less educated).

The key factor is party loyalty.  And, at least in presidential elections, people do remain loyal. I think I once read, “If you can get them for two consecutive elections, you’ve got them for life.”  Or words to that effect.  If that’s true, the age patterns of the last two elections should be what the Republicans are worrying about.

2

Trying to make themselves more attractive to younger people will not be easy.  Oldsmobile tried it not so long ago (a post on that campaign is here).  “This is not your father’s GOP” might have similar lack of success.  But insisting that this is still your father’s GOP (or more accurately, some white dude’s father’s GOP) seems like a formula for failure.

Jay Livingston is the chair of the Sociology Department at Montclair State University. You can follow him at Montclair SocioBlog or on Twitter.

The year during which the U.S. will become a “majority minority” is well discussed.  It looks like it’s going to happen sometime around 2050 or earlier. This statistic, however, elides an interesting subplot: the year various age groups will be majority minority.

Over at The Society Pages Editors’ Desk, sociologist Doug Hartmann offered the following table. It shows that children under the age of 18 will be majority minority 32 years earlier, by 2018.  Young people ages 18-29 will join them by 2027.  By 2035, people aged 35-64 will be majority minority.  People 65 and older are quick to follow.

This data reminds us that demographic change is gradual.  The year 2018 is just five years away.  If young people continue to vote in numbers similar to those in the last two elections, their changing demographics could push forward a change that looks all but inevitable in the long run.

In the meantime, we need to be vigilant about how younger people are portrayed.  Today poverty is racialized so as to demonize social programs designed to help the less fortunate.  Can we imagine a future in which public education and other youth-oriented programming is similarly framed: as white people helping supposedly undeserving people of color?  This is likely something that we should be vigilant against in the coming years.

Lisa Wade, PhD is an Associate Professor at Tulane University. She is the author of American Hookup, a book about college sexual culture; a textbook about gender; and a forthcoming introductory text: Terrible Magnificent Sociology. You can follow her on Twitter and Instagram.

As politicians negotiated regarding the fiscal cliff, they debated whether to cut social programs aimed at alleviating poverty and deprivation.  Most of us imagine that these programs help a minority of the population.  In fact, the Pew Research Center reports that more than half of the population has received government benefits from one of the six most well-known programs:

This isn’t the so-called 47% that Romney claimed would vote for a Democrat no matter what.  In fact, people who received one of these six benefits were only slightly more likely to vote Democratic:

In fact, receiving benefits is pretty well spread out among the population. Except for people over 65, there seems to be significant consistency in the receipt of at least one benefit:

Notably, these programs also go to help the poor, women (largely because they end up single with young children), and people in rural areas.

Interestingly, many of us who have benefited from targeted government programs (“targeted” because we all benefit from programs like, oh, transportation initiatives and environmental protection and [insert dozens more here]) don’t know that we do.  In a previous post, we showed that large proportions of people who’ve benefited from social programs don’t recognize that they have unless their thinking is sparked by asking them about specific programs.  (It’s kind of like responding “No I don’t do drugs” and then being asked specifically about marijuana and saying, “Oh yeah, well that one I guess!”).

Since it is indeed the majority of Americans who benefit from targeted programs, it shouldn’t be too hard for politicians to find it in their hearts to support these programs.  That 57% of conservatives and 52% of Republicans have used them suggests that the political right is more interested in purporting an ideology than serving its constituency.

Alternatively, they realize that a certain proportion of benefit recipients also believe that the government “does not have the responsibility to care for those who cannot care or themselves.” About a third of people who hold onto this principle have used benefits:

It seems that data like this might be very useful for what we really need: an educational campaign designed to help Americans understand what social programs do and who benefits from them.   Maybe then we could have sensible policy discussions.

Lisa Wade, PhD is an Associate Professor at Tulane University. She is the author of American Hookup, a book about college sexual culture; a textbook about gender; and a forthcoming introductory text: Terrible Magnificent Sociology. You can follow her on Twitter and Instagram.