Search results for okcupid

Usually, you want to match up with someone at about your level, or a little higher.  The trouble is that many people overestimate their own level.  Maybe that’s especially true of men.

One summer many years ago at the tennis courts, a guy I didn’t know  came over and asked me if I’d like to play. I hadn’t arranged a game with anyone, but I didn’t want to wind up playing some patzer.

“Are you any good?” I asked. He paused.

“Well, I’m not Jimmy Connors,” he said (I told this was many years ago), “but neither are you.”

In chess and other games, serious players have ratings. Give a roomful of possible partners, they can sort through the ratings and find a match with someone at roughly the same level.  It’s called assortative mating, though that term usually refers to the other kind of mating, not chess.  It’s the basis of the conflict in this poignant scene from “Louie.”

Vanessa is not a ten, neither is Louie.  According to principles of assortative mating, the tens will wind up with other tens, the nines with nines, and so on down the attractiveness scale. One problem in the “Louie” scene is that Louie seems to have an inflated view of his own attractiveness.  He’s aiming higher than Vanessa.  That’s typical.  So is the importance that Louie, the man, places on physical attractiveness. This excerpt begins with Louie telling Vanessa that she’s a really beautiful . . . . He can’t bring himself to say “girl”; he’s probably going to say “person.” But he’s obviously not saying what he thinks.

Or as Dan Ariely and colleagues concluded from their study of HotOrNot members:

[Men] were significantly more influenced by the consensus physical attractiveness of their potential dates than females were. [Men also] were less affected by how attractive they themselves were . . .  In making date choices, males are less influenced by their own rated attractiveness than females are.

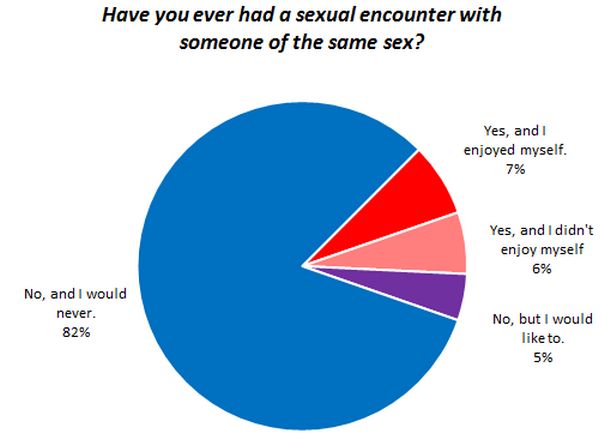
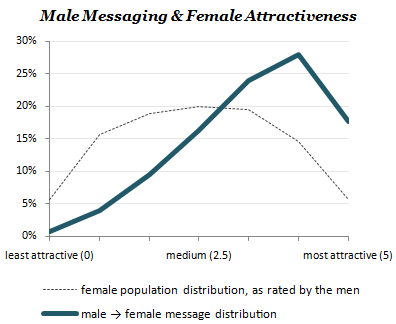
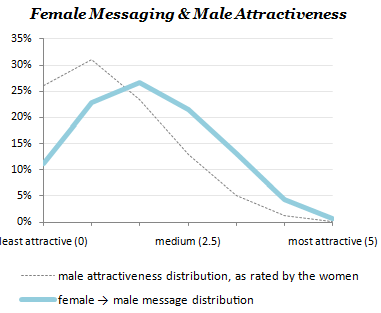
Another dating site, OK Cupid, found a similar pattern when they looked at data about who gets messages.  They asked their customers to rate profile photos of the opposite sex on a scale of 0 to 5. They then tracked the number of messages for people at each level of attractiveness.  The graph below shows what women thought and what they did – that is, how attractive they found men, and who they sent messages to.

1 (2) - Copy

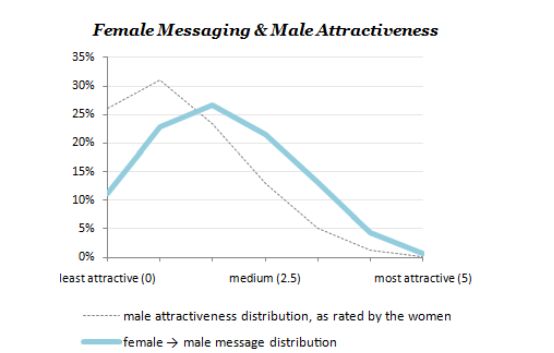
Men who were rated 0 or 1 got fewer messages than their proportion in the population.  That figures. But even men who were only moderately attractive got more than their share. Generally, the fewer men at a level of attractiveness, the fewer total messages women sent. The 4s, for example, constituted only 2% of the population, and they got only 4% of all the messages.  The Vanessas on OK Cupid are not sending a lot of inquiries to guys who look like George Clooney.

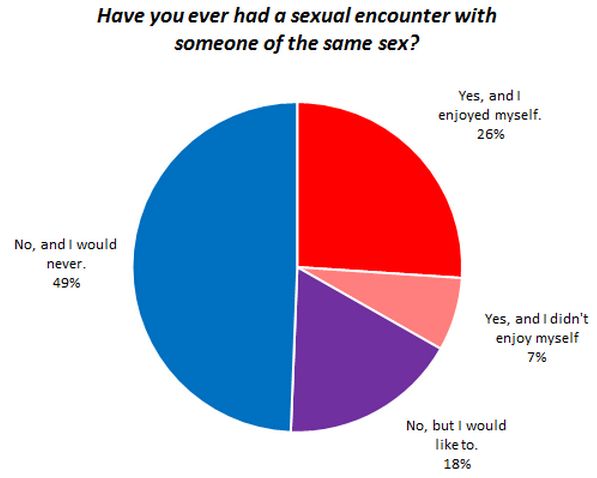
But look at the men.

1 (2)

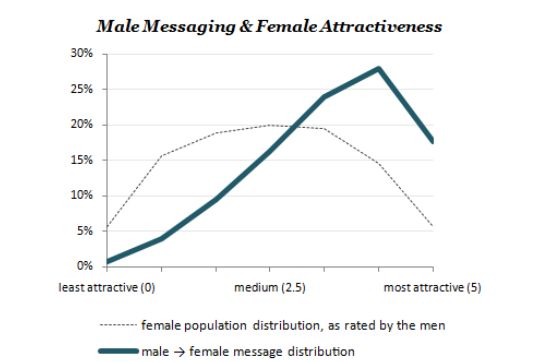
Men are more generous in their estimates of beauty than are women. But they also ignore the Vanessas of the world (or at least the world of OK Cupid) and flock after the more attractive women.  Only 15% of the women were rated as a 4, but they received about 26% of the messages.  Women rated 5 received messages triple their proportion in the population.

What about those with so-so looks?  Women rated as 2s received only about 10% of the messages sent by men. But men at that same level received 25% of the messages women sent.  The women seem more realistic.

Vanessa too has no illusions about her own attractiveness. She refers to herself as “a fat girl,” and when Louie, trying to be kind, says, “You’re not fat,” she says: “You know what the meanest thing is you can say to a fat girl? [pause] ‘You’re not fat.’” But it’s only when she challenges Louie’s view of his own attractiveness that their relationship starts to change.

Y’know if you were standing over there looking at us, you know what you’d see?

What?

That we totally match. We’re actually a great couple together.

She doesn’t explain what she means by “totally match.” It could be their interests or ideas or personalities, but the imaginary stranger looking at them from over there couldn’t know about any of that. What that generalized other could see is that they are at roughly the same place on the assortative mating attractiveness scale.

Cross-posted at Pacific Standard.

Jay Livingston is the chair of the Sociology Department at Montclair State University. You can follow him at Montclair SocioBlog or on Twitter.

Course Guide for
ASIAN AMERICANS AND PACIFIC ISLANDERS
(last updated 04/2013)


Developed by Calvin N. Ho
University of California, Los Angeles


Social Construction of Race and Ethnicity

Doing race and ethnicity

Racial mixing and multiraciality

Colonialism, Neocolonialism, and Exotification

Geopolitics

Racism, Discrimination, and Stereotypes

Gender and Sexuality

Statistics on Asian Americans and Pacific Islanders

Geography of Asian Americans and Pacific Islanders

Labor Market Segmentation and Socioeconomic Mobility

Course Guide for
SEXUALITY AND SOCIETY
(last updated 01/2012)


Developed by Amanda M. Jungels
Georgia State University


Integrating/Interrogating Biological and Social Views of Sexuality

Challenging Evolutionary Perspectives on Sex/Sexuality

Social Construction of (Biological) Sex


Social Construction: Changing Views on Sexuality


Sexuality and Social Categories

Social Construction of Gender

Transgender/Third Gender/Gender Queer

Social Construction of Sexual Orientation


Learning about Sex/Sex Education           

Sex Education

Abstinence vs. Comprehensive Sex Ed

Sexual Practices


The Sexual Body

The Female Body

Menstruation


Presenting the Female Body as Unclean: Removing Body Hair


Presenting the Female Body as Unclean: Douching

Bodily Modification and Female Genital Cutting


Social Construction of the Male Body/Male Sexuality

Presenting the Penis as a Dangerous Weapon


Representing Sex

Sexualization of Children’s Products

Sex in the Media

Ejaculation and Phallic Imagery

Sex and Violence

Objectification

Infantilization of Women

Forced/Coerced Sex

Sexual Script

Rape Culture

Use of Alcohol as a Tool for Coercive Sex

Sexual Assault Prevention Campaigns


Commercial Sex

Pornography

Contemporary Views on Prostitution

Historical Perspectives on Prostitution

Sex Trafficking

Other Forms of Sex Work

Social Control of Sex Work


Reproduction/Abortion

Reproduction

Abortion


Sterilization


Contemporary GLBT Issues

Gay Rights Movement

GLBT Parenting

Same-Sex Marriage

GLBT-Related Legislation

Course Guide for
SOCIOLOGICAL RESEARCH METHODS
(last updated 10/2011)

Developed by Lisa Wade
Occidental College

Disclaimer: This course guide is far from comprehensive, but it does collect what we have in an organized way. If you’re a methods instructor, and would like to write a guest post, please do!


Research Design

On Objectivity

Sampling

Delimiting Variables

Operationalization

Research Ethics


Methodological Approaches

Surveys


Data Analysis and Interpretation

Data Requires Interpretation

Correlation vs. Causation

Spurious Relationships

Mean vs. Categorical Difference

Paying Attention to Variance

Statistical Significance


Communicating Results

Types of Graphs

The X and Y Axis

(Mis)Representing Data

Lying with Statistics

Publishing

I often find myself bemused at our insistence on using sex (i.e., male or female) as the defining thing that describes our sexual orientation.  We are homosexual, heterosexual, or bisexual, right?  These words supposedly mean that we are sexually attracted to the same sex, the other sex, or both.  Right?

No! Not by a long shot! Essentially no one is attracted to men, for example, no matter what their sexual orientation.  I’m straight and female, but I am attracted to a very, very, very small subset of men. I’m generally only attracted to men within a certain age range, with kind faces (I find the chiseled look a bit intimidating); also, I prefer them to be relatively clean.  If I can add non-physical characteristics, then being aggressive with buddies or rude to waitstaff or prone to jealousy are all turn-offs, as are certain politics.  I’ll stop here.  Suffice to say, suggesting that I’m attracted to men is a vast overstatement.  Sexual orientation, as we think of it, simply doesn’t describe my proclivities. I suppose this is true for most of us.

I was reminded of this idea when I came across an OK Cupid post.  Christian Rudder drew on the profiles of over 250,000 heterosexual users, discovering that a large percentage of them had (positive) sexual experiences with people of the same sex, or wanted to (source).

Thirteen percent of self-identified straight men have had a sexual encounter with another man.  Seven percent of them enjoyed it.  Another 5% haven’t had the pleasure, but they would like to.

Significantly more self-identified straight women, 33%,  have had a sexual encounter with another woman.  Twenty-six percent of them enjoyed it.  Another 18% haven’t, but they would like to.  Less than half reported that they hadn’t and figured they never would.

Reported sexual orientation, then, simply doesn’t map perfectly onto desires or behaviors, in addition to failing to capture the full complexity of our sexualities.

For more of OK Cupid’s data, see our posts on the racial politics of datingwhat women wanthow attractiveness mattersage, gender, and the shape of the dating poololder women want more sex, and the lies love-seekers tell.

Lisa Wade, PhD is an Associate Professor at Tulane University. She is the author of American Hookup, a book about college sexual culture; a textbook about gender; and a forthcoming introductory text: Terrible Magnificent Sociology. You can follow her on Twitter and Instagram.

I may not have found the love of my life on OkCupid, but I did fall in love… with their data analysis!

Their latest super-fun post by Christan Rudder, sent along by Rob Walker, Sara P. and an Anonymous Reader, looks at the lies people tell in their profiles.  They do this not by catching any given individual in a lie, but by comparing data on their users to data on the general U.S. population.  (It’s unclear what percentage of OkCupid users are American and they don’t specify if they are only looking at U.S. users, so I can’t verify that this is a fair comparison but… if they do restrict the analysis to Americans then…)  Since they have 1.51 million active users, we should expect that any distributions should more or less overlap.

But they don’t…

1.  Men lie about their height, reporting, on average, that they are about two inches taller than they are.  In the figure below, the solid purple line represents the U.S. population, the dashed line represents the reported height of OkCupid users:

2. Women lie about their height too.  Here’s the same figure for women (but with a dark purple implied best fit line; you can just ignore it):

3. People exaggerate their income, on average inflating it by about 20 percent (for this data, they controlled for regional differences in income).  The figure below, however, shows that the amount of exaggeration is related to age.  Both men (blue) and women (red) increasingly inflate their income up until around age 40.  After that, they just keep inflating it at about the same rate.

Rudder quips:

A woman may earn 76 cents on the dollar for the same work as a man, but she can fabricate, like, 85 cents no problem.

Oh and, yeah, there’s a reason why the men are lying (no word from Rudder on the women). Income is highly correlated with how many messages a man gets (red = fewer messages; green = more):

4. It also turns out that not all of the “recent pics” are actually recent. This is especially true for pictures rated “hot.” Rudder says that “hot” photos are more than twice as likely as “average” photos to be over three years old (12% and 5% respectively).

And the older a person is, the more likely they are to upload an older photo:

Fun!

Also from OkCupid: the racial politics of dating, what women want, how attractiveness matters, age, gender, and the shape of the dating pool, and older women want more sex.

Lisa Wade, PhD is an Associate Professor at Tulane University. She is the author of American Hookup, a book about college sexual culture; a textbook about gender; and a forthcoming introductory text: Terrible Magnificent Sociology. You can follow her on Twitter and Instagram.

Claire P. and Jessica Sherwood, of the Sociologists for Women in Society, sent in a link to some data, from OK Cupid, on women’s preferences for frequency of sex by county.  The uptake: Women’s preferences for the incidence of sex goes up as they age.  You can check out the interactive map, or just check out my screen shots below.

Preferences at age 20 (red = higher preference for once a week; blue = higher preference for once a day; white = in the middle):

Preferences at age 25:

Preferences at age 30:

Preferences at age 35:

Preferences at age 40:

Also from OK Cupid: the racial politics of dating, what women want, and men’s preference for younger women.

Lisa Wade, PhD is an Associate Professor at Tulane University. She is the author of American Hookup, a book about college sexual culture; a textbook about gender; and a forthcoming introductory text: Terrible Magnificent Sociology. You can follow her on Twitter and Instagram.

OKCupid, an online matchmaking site, offers data on gender and perceived attractiveness that I might use in my spring deviance course (via boing). The figures might help me make a Durkheimian society of (hot) saints point about the relative nature of beauty and a Goffman point on stigma affecting social interaction, while providing another illustration of the taken-for-grantedness of heteronormativity.

In any case, the first figure shows that male OKCupid ratings of female OKCupid users follows something like a normal distribution, with mean=2.5 on a 0-to-5 scale from “least attractive” to “most attractive.” Also, women rated as more attractive tend to get more messages. At first, I thought I saw evidence of positive deviance here, since women rated as most attractive get fewer messages than those rated somewhat below them — the 4.5s garner more attention than the 5.0s. But, as I’ll show below with the next chart, that would probably be an incorrect interpretation — confounding the “persons” in the dashed lines with the “messages” in the solid lines.

The next figure shows that female OKCupid users tend to rate most male OKCupid users as well below “medium” in attractiveness. According to OKCupid, “women rate an incredible 80% of guys as worse-looking than medium. Very harsh. On the other hand, when it comes to actual messaging, women shift their expectations only just slightly ahead of the curve, which is a healthier pattern than guys’ pursuing the all-but-unattainable.”

Hmm. The latter point isn’t wrong, I guess, but it shouldn’t obscure the bigger point that more attractive men still get more messages than less attractive men. Again, note that persons (OKCupid members) are the units of analysis for the dashed lines and messages (messages sent by OKCupid members) are the units for the solid lines. On first scan, I read the graph as suggesting that the top “attractiveness quintile” was getting fewer messages than the bottom attractiveness quintile — that uglier men were actually doing better than more attractive men — but that’s not the case at all. Instead, it just means that in the land of the hideous, the somewhat-less-than-loathsome man is king.

If almost everybody is rated as unattractive, most of the messages will go to those rated as unattractive. Nevertheless, the rate of messages-per-person still rises monotonically with attractiveness. As the “message multiplier” chart below shows, the most attractive men get about 11 times the messages of the least attractive men — and the most attractive women get about 25 times the messages of the least attractive women.

—————————

Chris Uggen is Distinguished McKnight Professor and Chair of Sociology at the University of Minnesota.  His writing appears in American Sociological Review, American Journal of SociologyCriminology, and Law & Society Review and in media such as the New York Times, The Economist, and NPR.  With Jeff Manza, he wrote Locked Out: Felon Disenfranchisement and American Democracy.

If you would like to write a post for Sociological Images, please see our Guidelines for Guest Bloggers.