Cross-posted at The Atlantic and Family Inequality.

The Census Bureau has a new report on nonmarital births. Based on the American Community Survey — the largest survey of its kind, and the only one big enough to track all states — the report shows that 35.7 percent of births in 2011 were to unmarried mothers.

Beneath the headline number, two patterns in the data will receive a lot of attention: education and race/ethnicity. I have a brief comment on both patterns.

Education

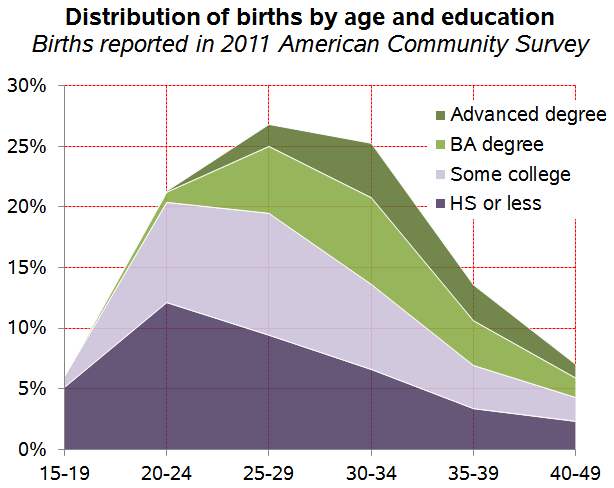
The education patterns show a very steep dropoff in nonmarital births as women’s education increases. From 57 percent unmarried among those who didn’t finish high school to just nine percent among those who have graduated college.

1

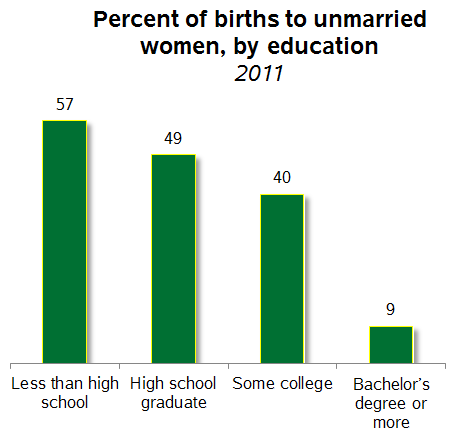
Given the hardships faced by single mothers (especially in the United States), it looks like women with more education are making the more rational decision to avoid childbearing when they’re not married. And I don’t doubt that’s partly the explanation. But we need to think about marriage, education and childbearing as linked events that unfold over time. The average high-school dropout mother was 26, while the average college-graduate mother was 33. Delaying childbearing and continuing education are decisions that are made together, based on the opportunities people have. And completing more education increases both the likelihood of marriage and the earning potential of one’s spouse.

So I think you could tell the story like this: Women with better educational opportunities delay childbearing, which increases their marriage prospects, and makes it more likely they will be married and financially better off when they have children in their 30s.

Race/Ethnicity

The differences in nonmarital birth rates between race/ethnic groups in the U.S. are shocking, from about two-thirds for black and American Indian women to 29 percent for whites and 11 percent for Asians.

2

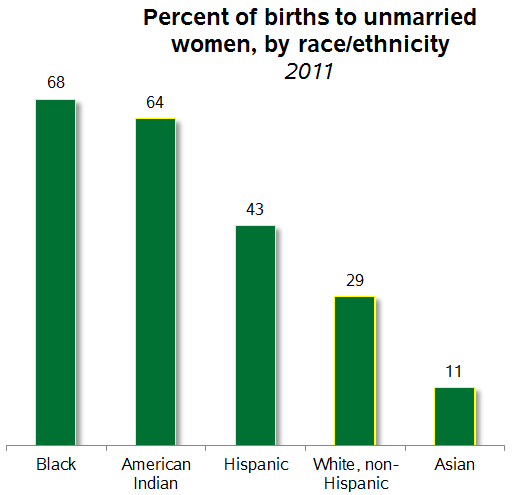
This pattern is related to the education trend, naturally, but that’s not the whole story. One aspect of the story is race/ethnic geography of opportunity in this country. I’ve written before about the shortage of employed men available for women to marry, a particular expression of racial disparity first popularized by sociologist William Julius Wilson a quarter century ago.

Using the new numbers on nonmarital birth rates for each state from the Census report, I compared them to the male non-employment rate — specifically, the percentage of unmarried men ages 22-50 that are not currently employed. Here’s the relationship:

3

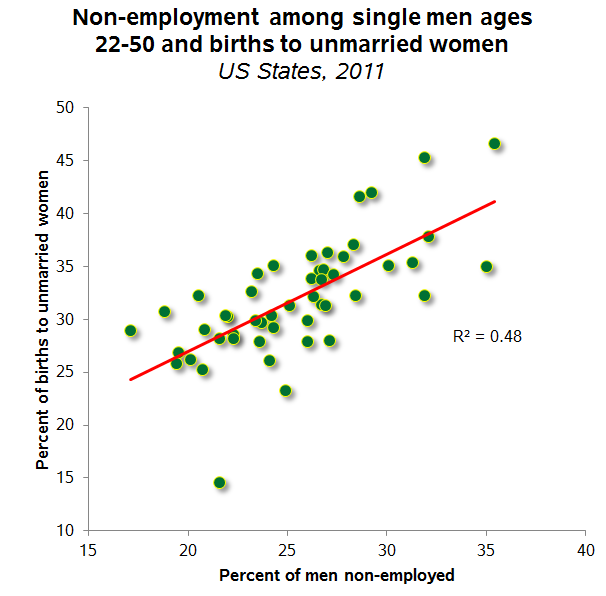
The states with more single men out of work have higher rates of nonmarital births. Single mother, meet jobless man.

My conclusion from these patterns is that unmarried parenthood is primarily a symptom of lack of opportunity, especially for education and employment. Surely that’s not the whole story. Maybe we should be persuading people to marry younger or shaming them into avoiding parenthood. But I think those approaches increase stigma more than they change behavior or improve wellbeing — Pew surveys show that 77 percent of people already say raising a family is easier if you’re married and only 12 percent of single people say they don’t want to marry. So who needs convincing? Meanwhile, if we addressed the problems of education and employment, is there any doubt family security and stability would improve, and with it the wellbeing of children and their parents?

Philip N. Cohen is a professor of sociology at the University of Maryland, College Park, and writes the blog Family Inequality. You can follow him on Twitter or Facebook.

Cross-posted at Family Inequality.

The U.S. Census Bureau has released its new report on childcare, written by Lynda Laughlin. This provides a good followup treatment for the hyperventilation induced by fear of fathers taking over (or being relegated to) childcare.

First, the trend that fits my story of stalled gender progress. Among married fathers with employed wives, how many are providing the “primary care” for their children? That is, among the various childcare arrangements the children are in while their mother is at work, how many are in their fathers’ care more than in any other arrangement? Answer:  10%, which is virtually unchanged from a quarter-century ago:

1

Not a lot of change for a quarter century in which we’re told everything has changed.

However, in fairness to the change-is-happening community, here is the trend for the percentage of fathers who say they are providing ANY care to their children while their mothers were at work.

2

I don’t give this much weight since it might reflect greater sensitivity to the importance of saying fathers provide care, but there you have it: it’s higher, and it shows some increases up until the early 1990s, which is when gender equality in general stalled on many indicators. Since the mid-1990s: Nothing.

Please note these figures don’t show the total contribution of fathers, but only reflects those married with children, whose wives are employed.

One interesting source of father care is mothers’ shiftwork. As Harriet Presser reported two decades ago, the 24/7 economy stimulates some task sharing among couples. In the current report, Laughlin writes:

Preschoolers whose mothers worked nights or evenings were more likely to have their father as a child care provider than those with mothers who worked a day shift (42 percent and 23 percent, respectively)

Philip N. Cohen is a professor of sociology at the University of Maryland, College Park, and writes the blog Family Inequality. You can follow him on Twitter or Facebook.

Cross-posted at Family Inequality.

The Pew Research Center put out a report this month titled, “Modern Parenthood: Roles of Moms and Dads Converge as They Balance Work and Family,” written by Kim Parker and Wendy Wang. It analyzes trends in time use among men and women in families, showing the big changes since the 1960s, and adds Pew’s own survey data on attitudes and perceptions. Lots of interesting information.

But what jumped out at me was that the stall in progress did not feature much in Pew’s narrative. I really noticed that when the Joy Cardin show featured the report on Wisconsin Public Radio, and Cardin’s intro was this:

Family gender roles are converging, according to a new survey from the Pew Research Center. Father’s have more than doubled the time they spend on housework. More moms are paid to work outside the home (audio here).

Those facts are true, but old news — older than the new news, which is that nothing much has happened since the early 1990s.  Here are the trends, in Pew’s nice graphics. See if you can find the stall point in each figure.

1 ****** 2 ****** 3 ****** 4 ****** 5 ****** 6

The last one, parents’ child care time, is the only one that shows continued real progress, albeit slower, in the last decade.

I favor three explanations for this gender stall:

  • Work-family policy that encourages specialization in domestic or labor force roles, as described by Stephanie Coontz here.
  • Cultural trends toward “egalitarian essentialism,” which “blends aspects of feminist equality and traditional motherhood roles” (e.g., intensive parenting mania), as described by David Cotter, Joan Hermsen and Reeve Vanneman here.
  • Weaker government enforcement of anti-discrimination law, as described in the new book Documenting Desegregation, by Don Tomaskovic-Devey and Kevin Stainback.

These explanations do not exclude others.

Philip N. Cohen is a professor of sociology at the University of Maryland, College Park, and writes the blog Family Inequality. You can follow him on Twitter or Facebook.

Cross-posted at Racialicious and Family Inequality.

Trying to summarize a few historical trends for the last half century, I thought of framing them in terms of diversity.

Diversity is often an unsatisfying concept, used to describe hierarchical inequality as mere difference. But inequality is a form of diversity — a kind of difference. And further, not all social diversity is inequality. When people belong to categories and the categories are not ranked hierarchically (or you’re not interested in the ranking for whatever reason), the concept of diversity is useful.

There are various ways of constructing a diversity index, but I use the one sometimes called the Blau index, which is easy to calculate and has a nice interpretation: the probability that two randomly selected individuals are from different groups.

Example: Religion

Take religion. According to the 2001 census of India, this was the religious breakdown of the population:

1.jpg

Diversity is calculated by summing the squares of the proportions in each category, and subtracting the sum from 1. So in India in 2001, if you picked two people at random, you had a 1/3 chance of getting people with different religions (as measured by the census).

Is .33 a lot of religious diversity? Not really, it turns out. I was surprised to read on the cover of this book by a Harvard professor that the United States is “the world’s most religiously diverse nation.” When I flipped through the book, though, I was disappointed to see it doesn’t actually talk much about other countries, and does not seem to offer the systematic comparison necessary to make such a claim.

With our diversity index, it’s not hard to compare religious diversity across 52 countries using data from World Values Survey, with this result:

2

The U.S. is quite diverse — .66 — but a number of countries rank higher.


Increasing U.S. Diversity

Anyway, back to describing the last half century in the U.S. On four important measures I’ve got easy-to-identify increasing diversity:

3

5

4

6

The last one is a little tricky. It’s common to report that the median age at marriage has increased since the 1950s (having fallen before the 1950s). But I realized it’s not just the average increasing, but the dispersion: More people marrying at different ages. So the experience of marriage is not just shifting rightward on the age distribution, but spreading out. Here’s another view of the same data:

7

I calculated these using the Panel Study of Income Dynamics from 1968 (for those married in the years 1950-1968) and comparing it with the 2011 American Community Survey for those married in the previous year. There might be a better way, of course.

I have complained before that using the 1950s or thereabouts as a benchmark is misleading because it was an unusual period, marked by high conformity, especially with regard to family matters. But it is still the case that since then diversity on a number of important measures has increased. Over the period of several generations, in important ways the people we randomly encounter are more likely to be different from ourselves (and each other).

Philip N. Cohen is a professor of sociology at the University of Maryland, College Park, and writes the blog Family Inequality. You can follow him on Twitter or Facebook.

Cross-posted at Family Inequality.

previously complained about Tangled‘s 75%-male cast and extreme sex dimorphism — the habit of exaggerating average differences between men and women — in the romantic leads, as seen in this hand shot:

Keeping to my policy of two-year delays in movie reviews, let me add the same complaint about Gnomeo and Juliet, the charming adaptation from Disney’s Touchstone imprint. Here, a writing team of 8 men and 2 women (including Shakespeare) gives us a named cast of 14 men and 7 women, in a love story featuring these two adorable garden gnomes:

He’s only a little taller, and (judging by the gray beard) a little older. And in the movie she demonstrates bravery and feats of strength, as is now the norm. But look at those hands! Take a closer look:

What is it about hands that makes it so essential for men and women to have such differences?

In the “man hands” episode of Seinfeld we learned how distressing it can be for a man to find out the woman to whom he was attracted has large hands.

That scene required a hand double. In real life, men’s and women’s hands differ on average but with a lot of overlap in the distributions — lots of men have hands smaller than lots of women. But in animation the gloves are off — and Disney is free to pair up couples who are many standard deviations apart in hand size.

Philip N. Cohen is a professor of sociology at the University of Maryland, College Park, and writes the blog Family Inequality. You can follow him on Twitter or Facebook.

Cross-posted at Family Inequality.

It’s not that “working families” don’t exist, it’s just the way most people use this term it doesn’t mean anything.  Search Google images for “working families,” and you’ll find images like this:

And that’s pretty much the way the term is used: every family is a working family.

To hear the White House talk, you have to wonder whether there are people who aren’t in families. I’ve complained about this before, Obama’s tendency to say things like, “This reform is good for families; it’s good for businesses; it’s good for the entire economy.” As if “families” covers all people.

Specifically, if you Google search the White House website’s press office directory, which is where the speeches live, like this, you get 457 results, such as this transcript of remarks by Michelle Obama at a “Corporate Voices for Working Families” event. The equivalent search for “working people” yields a paltry 108 hits (many of them Obama speeches at campaign events, which include false-positives, like him making the ridiculous claim that Americans are the “hardest working people on Earth.”) If you search the entire Googleverse for “working families” you get about 318 million hits, versus just just 7 million for “working people” (less than the 10 million that turns up for “Kardashians,” whatever that means.)

You would never know that 33 million Americans live alone — comprising 27% of all households. And 50 million people, or one out of every 6 people, lives in what the Census Bureau defines as a “non-family household,” or a household in which the householder has no relatives (some of those people may be cohabitors, however). The rise of this phenomenon was ably described by Eric Klinenberg in Going Solo: The Extraordinary Rise and Surprising Appeal of Living Alone.

This is partly a complaint about cheap rhetoric, but it’s also about the assumption that families are primary social units when it comes to things like policy and economics, and about the false universality of “middle class” (which is made up of “working families”) in reference to anyone (in a family with anyone) with a job.

Here’s one visualization, from a Google ngrams search of millions of books. The blue line is use of the phrase “working people” as a fraction of references to “people,” while the red line is use of the phrase “working families” as a fraction of references to “families.” It shows, I think, that “working” is coming to define families, not people.

This isn’t all bad. Families matter, and part of the attention to “working families” (or Families That Work) is driven by important problems of work-family conflict, unequal care work burdens, and so on. But ultimately these are problems because they affect people (some of whom are in families). When we treat families as the primary unit of analysis, we mask the divisions within families — the conflicts of interest and exploitation, the violence and abuse, and the ephemeral nature of many family relationships and commitments — and we contribute to the marginalization of people who aren’t in, or don’t have, families.  And those members of the No Family community need our attention, too.

Philip N. Cohen is a professor of sociology at the University of Maryland, College Park, and writes the blog Family Inequality. You can follow him on Twitter or Facebook.

Cross-posted at Family Unequal.

As I wrote about the older-birth-mothers issue recently (first, and then), I didn’t comment on the photo illustrations people are using with the stories. But when an alert reader sent this one to me, from Katie Roiphe’s post in Slate, I couldn’t help it:

Something about that picture and “women in their late 30s or 40s” rubbed my correspondent the wrong way, or rather, led her to write, “Late 30s or early 40s?!?”

Since this was from a legit website that credits its stock agency, I was able to visit Thinkstock and search for the photo. Sure enough:

Of course, it’s not news, so the title “Middle-aged woman holding her newborn grandson” doesn’t make it a less true illustration of the older-mother phenomenon than one captioned “Desperate aging woman clings to feminist myth that it’s OK to delay childbearing.” But it gives you an idea of what the Slate editor was looking for in the stock photo.

I looked around a little, and found one other funny one. Another Slate essay,this one by Allison Benedikt, was reprinted in Canada’s National Post, and they laid it out like this:

When I visited the Getty Images site, I discovered this picture was taken in China. Here’s how it’s presented:

This one, which is a picture of real people, looks like it could be a grandmother, or maybe more likely a caretaker. Regardless, it’s sold as an illustration of a story about China’s elderly having too few grandchildren to take care of them, which is vaguely related to the content of the story, but that’s not what the Post’s caption points to:

It’s true that older parents are more established and experienced but many of those experiences are, from a genetic point of view, negative, says Allison Benedikt.

Anyway, there were others where the women looked pretty old for the story, but I couldn’t find them in the catalogs, so I stopped.

This is all relevant to one of my critiques of these stories, which is that they make it seem like having children at older ages has become more common than it was in the past. That’s true compared with 1980, but not 1960. The difference is it’s more likely to be their first child nowadays. So Benedikt is way off when she writes,

Remember how there was that one kid in your high school class whose parents were sooooo old that it was weird and creepy? That’s all of us now. Oops.

As I showed, 40-year-old women are less likely to have children now than they were when she was a kid. And when Roiphe writes of the “50-year-old mother in the kindergarten class [who] attracts a certain amount of catty interest and disapproval,” she should be aware that the disapproval — which I don’t doubt exists — is not about the increased frequency of older mothers, but about how people think about them.

Philip N. Cohen is a professor of sociology at the University of Maryland, College Park, and writes the blog Family Inequality. You can follow him on Twitter or Facebook.

Cross-posted at Family Inequality and The Atlantic.

The problem of income inequality often gets forgotten in conversations about biological clocks.

The dilemma that couples face as they consider having children at older ages is worth dwelling on, and I wouldn’t take that away from Judith Shulevitz’s essay in the New Republic, “How Older Parenthood Will Upend American Society,” which has sparked commentary from Katie RoipheHanna RosinRoss Douthat, and Parade, among many others.

The story is an old one — about the health risks of older parenting and the implications of falling fertility rates for an aging population — even though some of the facts are new. But two points need more attention. First, the overall consequences of the trend toward older parenting are on balance positive, both for women’s equality and for children’s health. And second, social-class inequality is a pressing — and growing — problem in children’s health, and one that is too easily lost in the biological-clock debate.

Older mothers

First, we need to distinguish between the average age of birth parents on the one hand versus the number born at advanced parental ages on the other. As Shulevitz notes, the average age of a first-time mother in the U.S. is now 25. Health-wise, assuming she births the rest of her (small) brood before about age 35, that’s perfect.

Consider two measures of child well-being according to their mothers’ age at birth. First, infant mortality:

(Source: Centers for Disease Control)

Health prospects for children improve as women (and their partners) increase their education and incomes, and improve their health behaviors, into their 30s. Beyond that, the health risks start accumulating, weighing against the socioeconomic factors, and the danger increases.

Second, here is the rate of cognitive disability among children according to the age of their mothers at birth, showing a very similar pattern:

(Source: Calculations made for my working paper)

Again, the lowest risks are to those born when their parents are in their early 30s, a pattern that holds when I control for education, income, race/ethnicity, gender, and child’s age.

When mothers older than age 40 give birth, which accounted for 3 percent of births in 2011, the risks clearly are increased, and Shulevitz’s story is highly relevant. But, at least in terms of mortality and cognitive disability, an average parental age in the late 20s and early 30s is not only not a problem, it’s ideal.

Unequal health

But the second figure above hints at another problem — inequality in the health of parents and children. On that purple chart, a college graduate in her early 40s has the same risk as a non-graduate in her late 20s. And the social-class gap increases with age. Why is the rate of cognitive disabilities so much higher for the children of older mothers who did not finish college? It’s not because of their biological clocks or genetic mutations, but because of the health of the women giving birth.

For healthy, wealthy older women, the issue of aging eggs and genetic mutations from fathers’ run-down sperm factories are more pressing than it is for the majority of parents, who have not graduated college.

If you look at the distribution of women having babies by age and education, it’s clear that the older-parent phenomenon is disproportionately about more-educated women. (I calculated these from the American Community Survey, because age-by-education is not available in the CDC numbers, so they are a little different.)

Most of the less-educated mothers are giving birth in their 20s, and a bigger share of the high-age births are to women who’ve graduated college — most of them married and financially better off. But women without college degrees still make up more than half of those having babies after age 35, and the risks their children face have more to do with high blood pressure, obesity, diabetes, and other health conditions than with genetic or epigenetic mutations. Preterm births, low birth-weight, and birth complications are major causes of developmental disabilities, and they occur most often among mothers with their own health problems.

Most distressing, the effects of educational (and income) inequality on children’s health have been increasing. Here are the relative odds of infant mortality by maternal education, from 1986 to 2001, from a study in Pediatrics. (This compares the odds to college graduates within each year, so anything over 1.0 means the group has a higher risk than college graduates.)

This inequality is absent from Shulevitz’s essay and most of the commentary about it. She writes, of the social pressure mothers like her feel as they age, “Once again, technology has given us the chance to lead our lives in the proper sequence: education, then work, then financial stability, then children” — with no consideration of the 66 percent of people who have reached their early 30s with less than a four-year college degree. For the vast majority of that group, the sequence Shulevitz describes is not relevant.

In fact, if Shulevitz had considered economic inequality, she might not have been quite as worried about advancing parental age. When she worries that a 35-year-old mother has a life expectancy of just 46 more years — years to be a mother to her child — the table she consulted applies to the whole population. She should breathe a little bit easier: Among 40-year-old white college graduates women are expected to live an average extra five years compared with those who have a high school education only.

When it comes to parents’ age versus social class, the challenges are not either/or. We should be concerned about both. But addressing the health problems of parents — especially mothers — with less than a college degree and below-average incomes is the more pressing issue — both for potential lives saved or improved and for social equality.

Philip N. Cohen is a professor of sociology at the University of Maryland, College Park, and writes the blog Family Inequality. You can follow him on Twitter or Facebook.