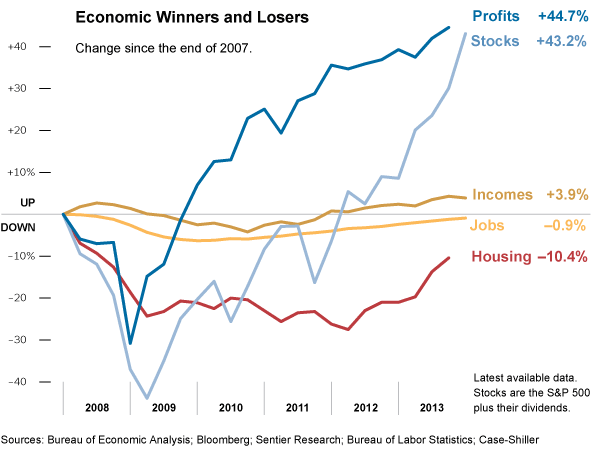
In a fancy bit of marketing, U.S. capitalists have been reborn as “job creators.”  As such, they were rewarded with lower taxes, weaker labor laws, and relaxed government regulation. However, despite record profits, their job creation performance leaves a lot to be desired.

According to the official data the last U.S. recession began in December 2007 and ended in June 2009. Thus, we have officially been in economic expansion for almost five years.  The gains from the expansion should be strong and broad-based enough to ensure real progress for the majority over the course of the business cycle.  If not, it’s a sign that we need a change in our basic economic structure.  In other words, it would be foolish to work to sustain an economic structure that was incapable of satisfying majority needs even when it was performing well according to its own logic.

A recent study by the National Employment Law Project titled The Low-Wage Recovery provides one indicator that it is time for us to pursue a change.  It shows that the current economic expansion is transitioning the U.S. into a low wage economy.

The figure below shows the net private sector job loss by industries classified according to their medium wage from January 2008 to February 2010 and the net private sector job gain using the same classification from March 2010 to March 2014. As we can see, the net job loss in the first period was greatest in high wage industries and the net job creation in the second period was greatest in low wage industries.

1 (2) - Copy

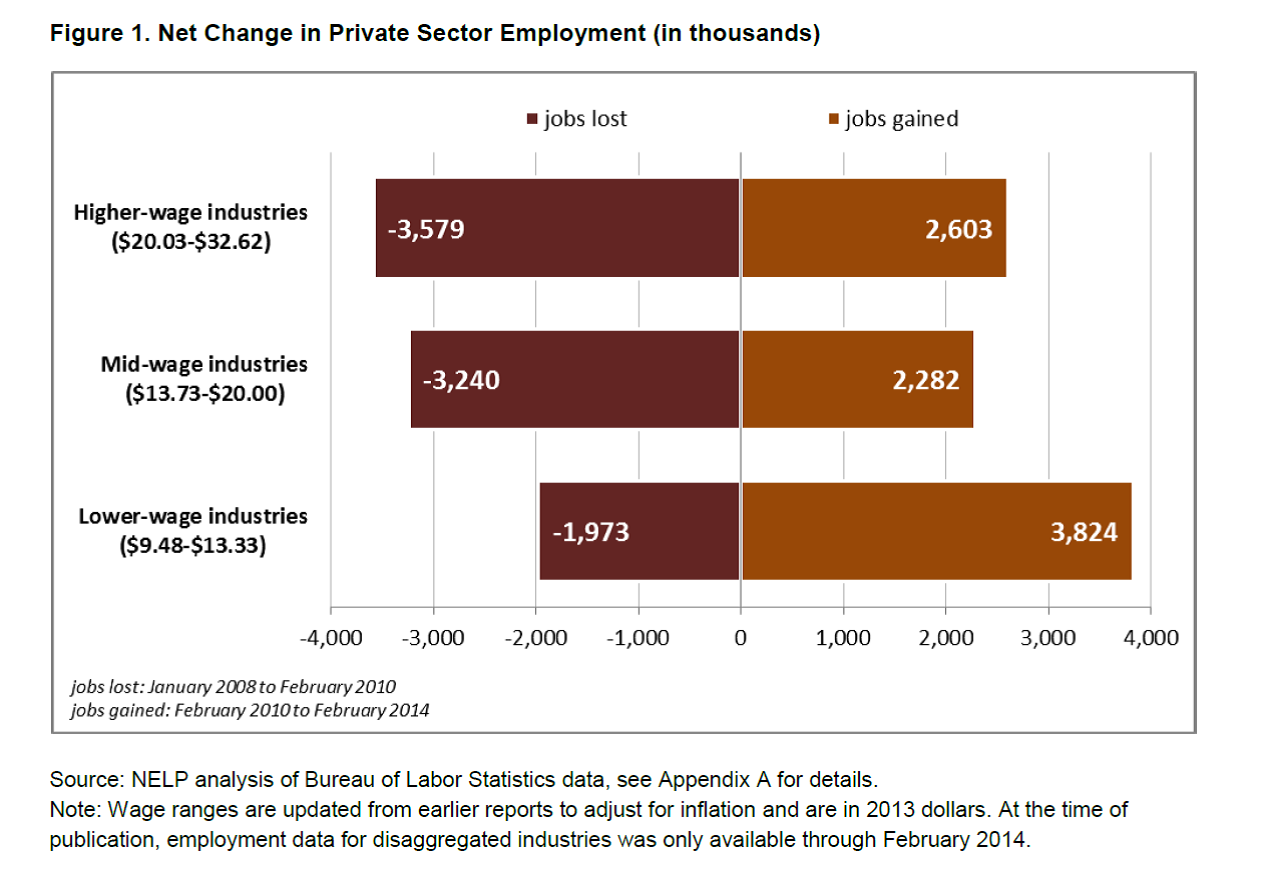
As the study explains:

 The food services and drinking places, administrative and support services (includes temporary help), and retail trade industries are leading private sector job growth during the recent recovery phase. These industries, which pay relatively low wages, accounted for 39 percent of the private sector employment increase over the past four years.

If the hard times of recession disproportionately eliminate high wage jobs and the “so called” good times of recovery bring primarily low wage jobs, it is time to move beyond our current focus on the business cycle and initiate a critical assessment of the way our economy operates and in whose interest.

Cross-posted at Pacific Standard.

Martin Hart-Landsberg is a professor of economics at Lewis and Clark College. You can follow him at Reports from the Economic Front.

This chart comes from Chuck Marr at the Center on Budget and Policy Priorities.  As Marr explains:

The United States is a relatively low-tax country, as the chart shows.  When measured as a share of the economy, total government receipts (a broad measure of revenue) are lower in the United States than in any other member of the Organization for Economic Co-operation and Development (OECD), even after accounting for the modest revenue increases in the 2012 “fiscal cliff” deal and the taxes that fund health reform.

1 (2) - Copy

Martin Hart-Landsberg is a professor of economics at Lewis and Clark College. You can follow him at Reports from the Economic Front.

On average, U.S. workers with jobs put in more hours per year  than workers in most OECD countries. In 2012, only Greece, Hungary, Israel, Korea, and Turkey recorded a longer work year per employed person.

2

A long work year is nothing to celebrate. The following chart, from the same Economist article, shows there is a strong negative correlation between yearly hours worked and hourly productivity.

3.5

More importantly, the greater the number of hours worked per year, the greater the likelihood of premature death and poor quality of life.  This reality is highlighted in the following two charts taken from an article by Angus Chen titled “8 Charts to Show Your Boss to Prove That You Can Do More By Working Less.”

1 (2) - Copy

1 (2)

In sum, we need to pay far more attention to the organization and distribution of work, not to mention its remuneration and purpose, than we currently do.

Martin Hart-Landsberg is a professor of economics at Lewis and Clark College. You can follow him at Reports from the Economic Front.

There are now more people working as private security guards than high school teachers.

Samuel Bowles and Arjun Jayadev offer the following graph, highlighting the number of “protective service workers”* employed per 10,000 workers and the degree of income inequality in the year 2000 for 16 countries.  The United States is tops on both counts.

17greatdivide-img-tmagArticle-v3

Two things stand out from this graph beyond U.S. “leadership.”  The first is the relationship between the share of protective service workers  — or “guard labor” — and inequality.  As Bowles and Jayadev comment:

In America, growing inequality has been accompanied by a boom in gated communities and armies of doormen controlling access to upscale apartment buildings. We did not count the doormen, or those producing the gates, locks and security equipment. One could quibble about the numbers; we have elsewhere adopted a broader definition, including prisoners, work supervisors with disciplinary functions, and others.

But however one totes up guard labor in the United States, there is a lot of it, and it seems to go along with economic inequality. States with high levels of income inequality — New York and Louisiana — employ twice as many security workers (as a fraction of their labor force) as less unequal states like Idaho and New Hampshire.

When we look across advanced industrialized countries, we see the same pattern: the more inequality, the more guard labor. As the graph shows, the United States leads in both.

The second is the rapid rise in the U.S. share of guard labor and inequality from 1979 to 2000.

One can only wonder in what ways and for whom this large and growing dependence on guard labor represents a rational use of social resources.

* For those who like definitions: The category protective service workers includes those employed as Private Security Guards, Supervisors of Correctional Officers, Supervisors of Police and Detectives, Supervisors of all other Protective Service Workers, Bailiffs, Correctional Officers and Jailers, Detectives and Criminal Investigators, Fish and Game Wardens, Parking Enforcement Workers, Police and Patrol Officers, Transit and Railroad Police, Private Detectives and Investigators, Gaming Surveillance Officers, and Transportation Security Screeners.  A broader measure of guard labor might include members of the armed forces, civilian employees of the military, and those that produce weapons to those employed as protective service workers.  That total was 5.2 million workers in 2011.

Cross-posted at Reports from the Economic Front.

Martin Hart-Landsberg is a professor of economics at Lewis and Clark College. You can follow him at Reports from the Economic Front.

Thomas Piketty has just published a massive new book tackling the explosive growth in income inequality.  Here’s what it looked like in Europe and the United States in 2010 (source):
14
A New York Times review of the book, Capital in the Twenty-First Centurybegins as follows:

What if inequality were to continue growing years or decades into the future? Say the richest 1 percent of the population amassed a quarter of the nation’s income, up from about a fifth today. What about half?

To believe Thomas Piketty of the Paris School of Economics, this future is not just possible. It is likely…

His most startling news is that the belief that inequality will eventually stabilize and subside on its own, a long-held tenet of free market capitalism, is wrong. Rather, the economic forces concentrating more and more wealth into the hands of the fortunate few are almost sure to prevail for a very long time.

Piketty’s pessimistic view is based on his argument that income generated from capital normally grows faster than the economy or income from wages.  This means that the private owners of capital benefit disproportionately from growth, which makes it easier for them to increase their asset holdings and by extension future income.  And, since wealth and income translate into political power, we face a self-reinforcing dynamic leading to ever growing inequality.

This suggests that embracing a system based on maximizing the returns to private owners of capital is a mistake for the great majority of working people. A recent study by the investment bank Credit Suisse provides more evidence for this conclusion.  As Michael Burke explains,

The study… shows that long-term growth rates of GDP in selected industrialized economies are negatively correlated with financial returns to shareholders.

That is, the best returns for shareholders are from countries where GDP growth has been slowest, and vice versa. Where growth has been strongest, shareholder returns are weakest…

The negative correlation [seen in the chart below] does not prove negative causality. But it does support the theory which suggests that the interests of shareholders are contrary to the interests of economic growth and the well-being of the population.

mb

All this information is worth keeping in mind the next time business and political leaders tell us that the key to our well-being is boosting business confidence, the market, or private returns on investment.

Cross-posted at Reports from the Economic Front.

Martin Hart-Landsberg is a professor of economics at Lewis and Clark College. You can follow him at Reports from the Economic Front.

One conventional explanation for our economic problems seems to be that our businesses are strapped for funds.  Greater business earnings, it is said, will translate into needed investment, employment, consumption and, finally, sustained economic recovery.  Thus, the preferred policy response: provide business with greater regulatory freedom and relief from high taxes and wages.

It is this view that underpins current business and government support for new corporate tax cuts and trade agreements designed to reduce government regulation of business activity, attacks on unions, and opposition to extending unemployment benefits and increasing the minimum wage.

One problem with this story is that businesses are already swimming in money and they haven’t shown the slightest inclination to use their funds for investment or employment.

The first chart below highlights the trend in free cash flow as a percentage of GDP.  Free cash flow is one way to represent business profits.  More specifically, it is a pretax measure of the money firms have after spending on wages and salaries, depreciation charges, amortization of past loans, and new investment.  As you can see that ratio remains at historic highs.  In short, business is certainly not short of money.

1 (2)

So what are businesses doing with their funds?  The next chart looks at the ratio of net private nonresidential fixed investment to net domestic product (I use “net” rather than “gross” variables in order to focus on investment that goes beyond simply replacing worn out plant and equipment).  The ratio makes clear that one reason for the large cash flow is that businesses are not committed to new investment.  Indeed quite the opposite is true.

1 (3)

Rather than invest in plant and equipment, businesses are primarily using their funds to repurchase their own stocks in order to boost management earnings and ward off hostile take-overs, pay dividends to stockholders, and accumulate large cash and bond holdings.

Cutting taxes, deregulation, attacking unions and slashing social programs will only intensify these very trends.  Time for a new understanding of our problems and a very new response to them.

Cross-posted at Reports from the Economic Front.

Martin Hart-Landsberg is a professor of economics at Lewis and Clark College. You can follow him at Reports from the Economic Front.

Officially our most recent recession began December 2007 and ended June 2009.  The following chart provides an important perspective on the recovery period.

1

Stocks and profits have enjoyed a remarkable recovery.  While income is slightly up over the period, it is critical to remember that this is average income and the increase largely reflects gains for those at the very top of the income distribution.  Jobs and housing have yet to recover.

So, with returns to capital booming, it is easy to understand why business leaders are relatively content with current policies and, by extension, political leaders are reluctant to rock the boat.

Unfortunately, current policies are unlikely to do much to improve the job prospects or income of most workers.  In fact, the rise in business profits owes much to our depressed labor conditions.  Unless something dramatic happens, we can expect the next few years to look very much like the past few years.

Cross-posted at Reports from the Economic Front and Pacific Standard.

Martin Hart-Landsberg is a professor of economics at Lewis and Clark College. You can follow him at Reports from the Economic Front.

The federal minimum wage is $7.25 an hour.  Several states mandate a higher minimum wage; the state of Washington has the highest, at $9.19.

President Obama recently voiced his support for efforts to increase the minimum wage to $10.10.  The federal minimum wage was last raised in 2009 and certainly needs to be increased again.  The fact is that the federal minimum wage has not kept up with inflation.  As the New York Times graphic below shows, the current minimum wage is, when adjusted for inflation, 32% below what it was in 1968.  It is 8% below what it was in 2010.  In other words, those earning the minimum wage are suffering a real decline in income.

1

As for the appropriate value, why not $22.62?  That, as the graphic illustrates, is what the minimum wage would be if it grew at the same rate as the income of the top 1%. Alan Pyke explains:

[Such a large increase] may seem outlandish, but previous research indicates American workers have just about earned it. Worker productivity has more than doubled since 1968, and if the minimum wage had kept pace with productivity gains it would have been $21.72 last year. From 2000 to 2012 alone workers boosted their productivity by 25 percent yet saw their earnings fall rather than rise, leading some economists to label the early 21st century a lost decade for American workers.

Looked at from that perspective the current movement for a $15 hourly wage at fast food restaurants sounds reasonable.  

Martin Hart-Landsberg is a professor of economics at Lewis and Clark College. You can follow him at Reports from the Economic Front.