Search results for inequality

Who’s afraid of a global pandemic? We all are, at the
moment. But like so many other forms of fear, concern about medical issues is
much more acute for people in precarious and vulnerable social positions. The
privileged—particularly those who are white and upper class—can more afford not
to be preoccupied with health and medical concerns, including pandemics.

In our new book Fear Itself, we found consistent support for updating our classic theories about vulnerability. Classic theories often understand vulnerability in physical terms. But risk and vulnerability are also social, rather than primarily physical, and we found consistent evidence that members of disadvantaged status groups—particularly women, racial and ethnic minorities, and those with lower levels of social class—had higher levels of fear across many domains.

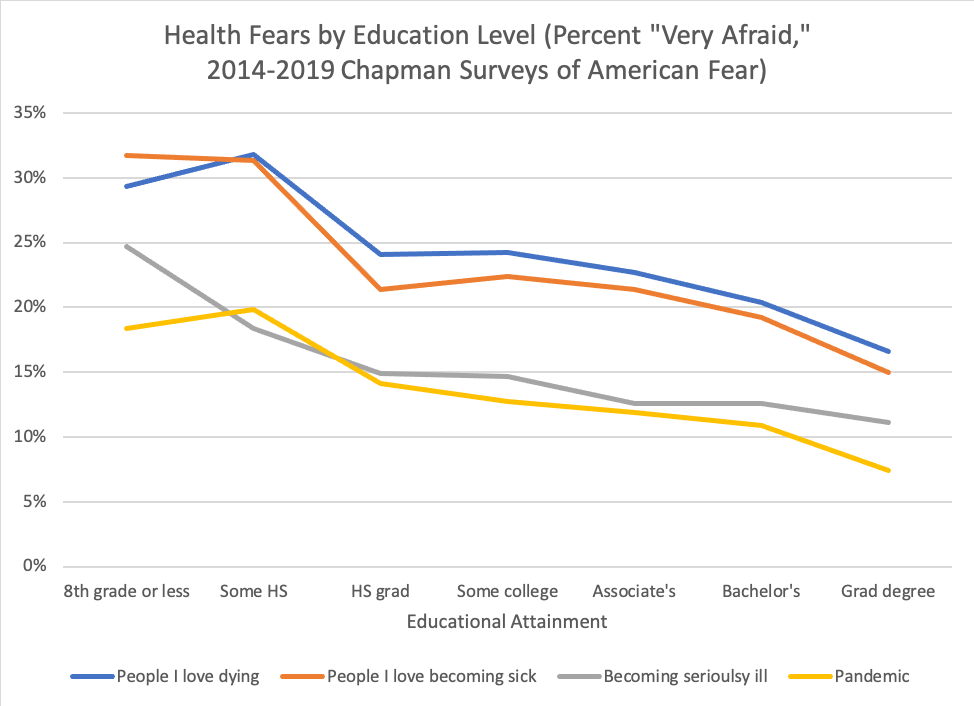
Using pooled data from six waves (2014–2019) of Chapman Survey of American Fears (CSAF), we examined the sociological patterns of fears about disease and health. We looked at fear about four specific issues: global pandemics, fears of becoming seriously ill, and fears about people you love becoming seriously ill or dying.     
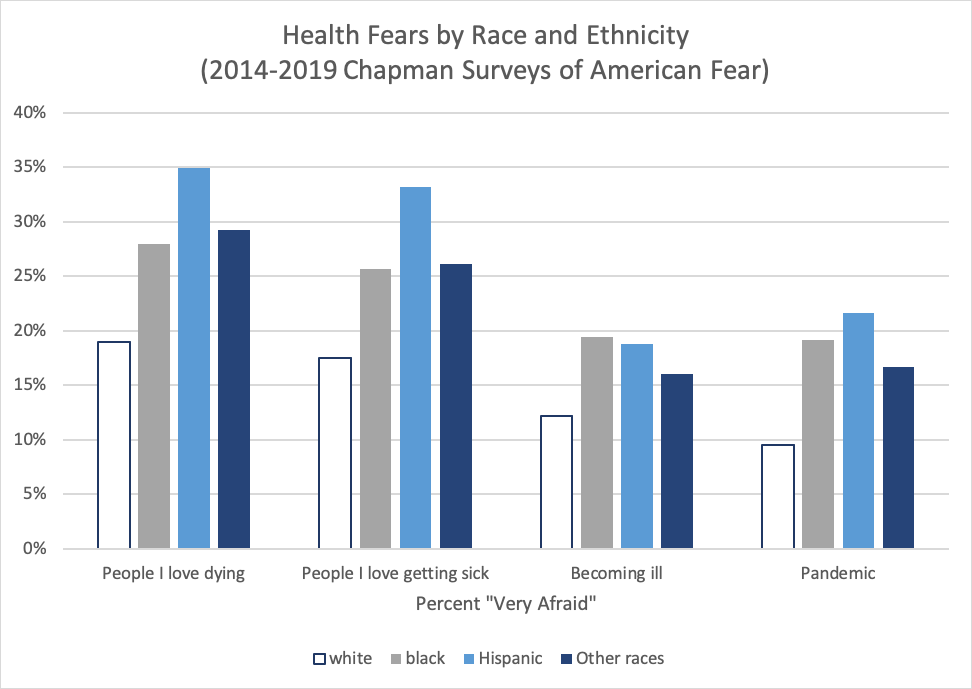
The racial and ethnic disparities across these four outcomes
are striking, with white Americans being significantly less likely to report
being “very afraid” of pandemics and medical issues involving themselves or
their families. Hispanic Americans reported the greatest concern about all four
issues, likely a reflection of lower rates of health care insurance and access
among Latino/a communities and individuals.

Likewise, we find clear disparities in fears about health and pandemics across different levels of education and family income. Again, the mechanisms are clear, with vast disparities in health care access in the United States, as well as the well-known social determinants of disease both playing a role.
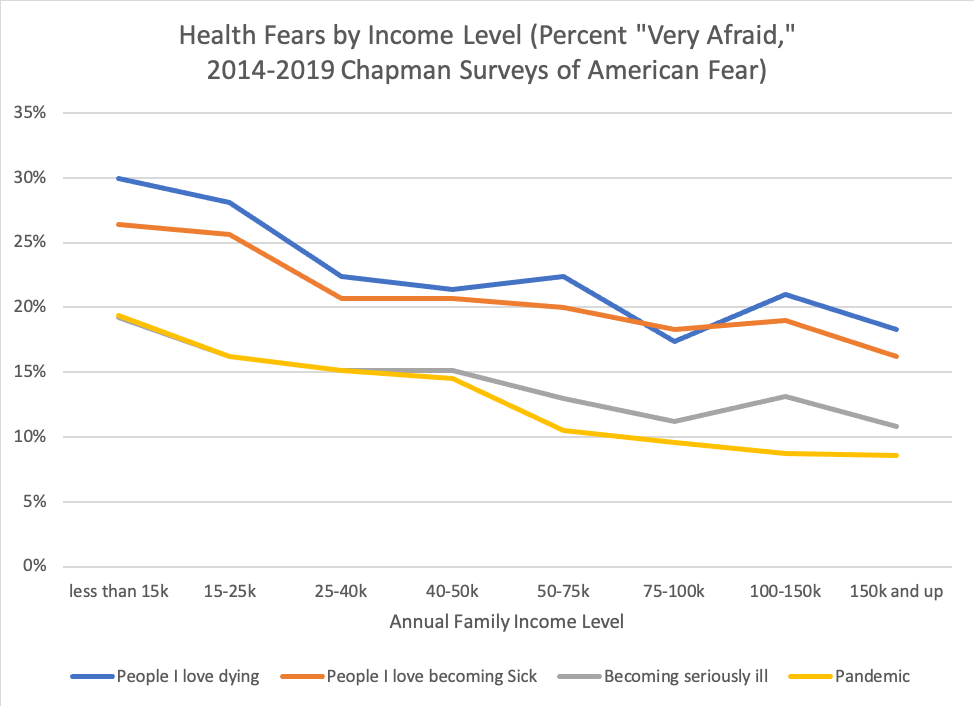
While these patterns are not necessarily surprising, they are nonetheless disconcerting, for a number of reasons. First, in terms of the epidemiology of the Coronavirus pandemic, it is the disempowered who will disproportionately bear the brunt of the negative health effects, and who will be least equipped with the resources to adequately respond if and when they get sick. Second, when preventative public health measures such as quarantines are put in place, it is people in the working and lower classes who can least afford to take time off of work or keep their children home from school in order to comply with public health procedures.
Not only does fear disproportionately prey upon people in less powerful social positions, it also exacerbates and deepens inequality. Higher levels of fear and anxiety are strongly and significantly related to harmful health outcomes, even after accounting for the social inequalities that structure who is afraid in the first place. In Fear Itself we created an omnibus fear metric we called the “Sum of All Fears” that combined levels of fear across a wide range of domains, including but not limited to health, crime, environmental degradation, and natural disasters. Scores on this global, summary fear metric once again produced strong support for social vulnerability theory; but levels of fear were also strongly connected to steep declines in quality of life across a range of domains, including social, personal, and financial well-being.
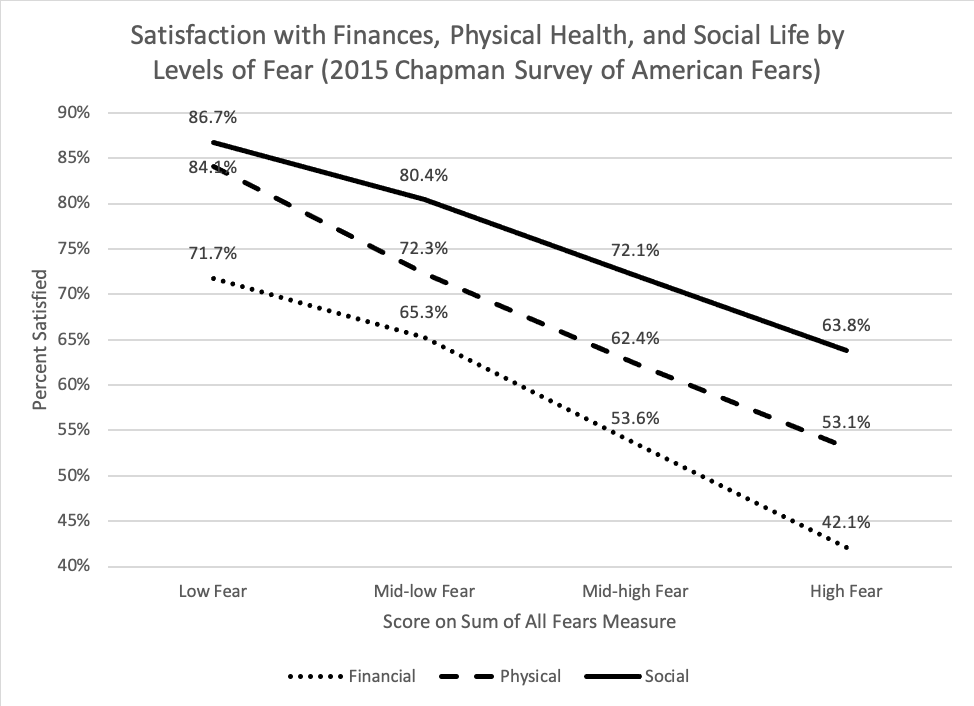
Taken together, fear is both a reflection of and a source of social inequality. This is true for the current global Coronavirus pandemic and the accompanying concerns, but it will also be the case long after the pandemic has passed. Our hope is that sociologists, social psychologists, and public health officials begin to consider how fear factors into and deepens social inequality.

Joseph O. Baker is Associate Professor in the Department of Sociology and Anthropology at East Tennessee State University and a senior research associate for the Association of Religion Data Archives.

Ann Gordon is Associate Professor of Political Science and Director of the Ludie and David C. Henley Social Science Research Laboratory, Chapman University.

L. Edward Day is Associate Professor and Chair of the Sociology Department at Chapman University.

Christopher D. Bader is Professor of Sociology at Chapman University and affiliated with the Institute for Religion, Economics and Culture (IRES). He is Associate Director of the Association of Religion Data Archives (www.theARDA.com) and principal investigator on the Chapman University Survey of American Fears.

It’s International Women’s Day–a day to celebrate the social, cultural, economic, and political achievements of women. It’s a day we often take stock of gender inequality, look at how far we’ve come and where we still need to go. This is a day people in my corner of the world share posts about the gender wage gap, statistics surrounding the enduring reality of violence against women, information about women’s access to health care, and more. It’s a day that sociologists have the tools to make lots of charts.

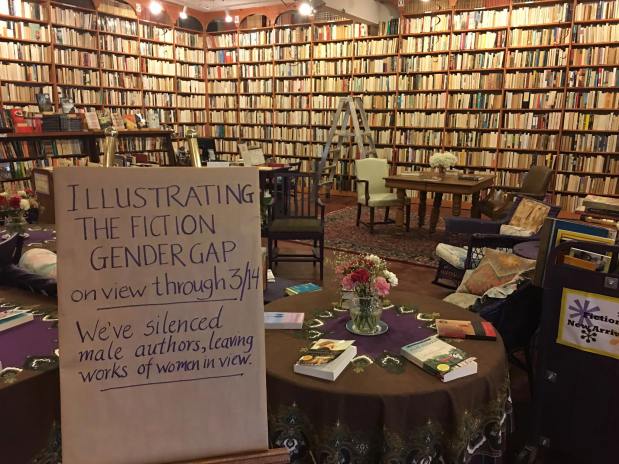
In my feed, sociologist Jane Ward shared a post about a feminist bookstore in Cleveland, Ohio that chose to celebrate Women’s History Month in a unique way: they flipped all of the books written by men in the fiction room of the store around on the shelf. The room will be left that way for for two weeks – through March 14, 2017. Take a look at the result!

The Fiction Room – Loganberry Books, Cleveland Ohio

It’s a powerful piece of feminist installation art. And it’s sociological. While a sociologist might have produced a content analysis of the room (or genre) and produced a proportion of books written by women, this feels different. They’ve entitled the exhibit “Illustrating the Fiction Gender Gap” and explain the project with this simple sentence: “We’ve silenced male authors, leaving works of women in view.”

They could have simply counted the books and produced figures made available to the public. That’s what most sociologists I know would have done. But something critical would have been missing when compared with the illustration of the gender gap they produced here. Think about it this way: in 2015, the Census calculated that the poverty rate was 13.5% in the U.S. (that was a drop from the year prior). In actual numbers, there were 43.1 million people in poverty in the U.S. that year. Just to think about the size of that group, that’s a number that is basically the same as the total combined state populations of New York, Florida, and Iowa. Can you imagine everyone in all three states being in poverty. That’s the scale of poverty as a social problem in the U.S.

In a similar way, Loganberry Books, produced a really clever piece of feminist installation art to make a reality about literature more visible. It’s different from telling us the proportion of books written by women in the fiction section. In Loganberry, we get to see what that means. If you went in, you could feel it as you looked around. Works by women who be jumping off the shelves, rather than hidden between piles of books by men.

The owner of the bookstore, Harriet Logan, put it this way: “Pictures are loud communicators.  So we are in essence not just highlighting the disparity but bringing more focus to the women’s books now, because they’re the only ones legible on the shelf” (here). In an interview with Cleveland Scene, she further explained: “To give the floor and attention to women, you need to be able to hear them. And if someone else is talking over them, that just doesn’t happen.”

It’s a small way of asking the question, What would this corner of the world look like if women’s accomplishments had not been systematically, structurally, and historically drowned out by men’s?  What does women’s signal sound like here when we get rid of men’s noise? Books by men are still there. They’re not being banned, removed, or even mentioned as “unworthy” in any way. Men’s books are simply being silenced for two weeks to let women’s work shine. What a powerful, feminist, sociologically imaginative statement.

Happy International Women’s Day!Tristan Bridges, PhD is a professor at the University of California, Santa Barbara. He is the co-editor of Exploring Masculinities: Identity, Inequality, Inequality, and Change with C.J. Pascoe and studies gender and sexual identity and inequality. You can follow him on Twitter here. Tristan also blogs regularly at Inequality by (Interior) Design.

Originally posted at Reports from the Economic Front.

Defenders of capitalism in the United States often choose not to use that term when naming our system, preferring instead the phrase “market system.”  Market system sounds so much better, evoking notions of fair and mutually beneficial trades, equality, and so on.  The use of that term draws attention away from the actual workings of our system.

In brief, capitalism is a system structured by the private ownership of productive assets and driven by the actions of those who seek to maximize the private profits of the owners.  Such an understanding immediately raises questions about how some people and not others come to own productive wealth and the broader social consequences of their pursuit of profit.

Those are important questions because it is increasingly apparent that while capitalism continues to produce substantial benefits for the largest asset owners, those benefits have increasingly been secured through the promotion of policies – globalization, financialization, privatization of state services, tax cuts, attacks on social programs and unions – that have both lowered overall growth and left large numbers of people barely holding the line, if not actually worse off.

The following two figures come from a Washington Post article by Jared Bernstein in which he summarizes the work of Thomas Piketty, Emmanuel Saez and Gabriel Zucman. The first set of bars shows the significant decline in US pre-tax income growth.  In the first period (1946-1980), pre-tax income grew by 95 percent.  In the second (1980-2014), it grew by only 61 percent.

income-trends

This figure also shows that this slower pre-tax income growth has not been a problem for those at the top of the income distribution.  Those at the top more than compensated for the decline by capturing a far greater share of income growth than in the past.  In fact, those in the bottom 50 percent of the population gained almost nothing over the period 1980 to 2014.

The next figure helps us see that the growth in inequality has been far more damaging to the well-being of the bottom half than the slowdown in overall income growth.  As Bernstein explains:

The bottom [blue] line in the next figure shows actual pretax income for adults in the bottom half of the income scale. The top [red] line asks how these folks would have done if their income had grown at the average rate from the earlier, faster-growth period. The middle [green] line asks how they would have done if they experienced the slower, average growth of the post-1980 period.

The difference between the top two lines is the price these bottom-half adults paid because of slower growth. The larger gap between the middle and bottom line shows the price they paid from doing much worse than average, i.e., inequality… That explains about two-thirds of the difference in endpoints. Slower growth hurt these families’ income gains, but inequality hurt them more.

inequality-versus-growth

A New York Times analysis of pre-tax income distribution over the period 1974 to 2014 reinforces this conclusion about the importance of inequality.  As we can see in the figure below, the top 1 percent and bottom 50 percent have basically changed places in terms of their relative shares of national income.

changing-places

The steady ratcheting down in majority well-being is perhaps best captured by studies designed to estimate the probability of children making more money than their parents, an outcome that was the expectation for many decades and that underpinned the notion of “the American dream.”

Such research is quite challenging, as David Leonhardt explains in a New York Times article, “because it requires tracking individual families over time rather than (as most economic statistics do) taking one-time snapshots of the country.”  However, thanks to newly accessible tax records that go back decades, economists have been able to estimate this probability and how it has changed over time.

Leonhardt summarizes the work of one of the most important recent studies, that done by economists associated with the Equality of Opportunity Project. In summary terms, those economists found that a child born into the average American household in 1940 had a 92 percent chance of making more than their parents.  This falls to 79 percent for a child born in 1950, 62 percent for a child born in 1960, 61 percent for a child born in 1970, and only 50 percent for a child born in 1980.

The figure below provides a more detailed look at the declining fortunes of most Americans.   The horizontal access shows the income percentile a child is born into and the vertical access shows the probability of that child earning more than their parents.   The drop-off for children born in 1960 and 1970 compared to the earlier decade is significant and is likely the result of the beginning effects of the changes in capitalist economic dynamics that started gathering force in the late 1970s, for example globalization, privatization, tax cuts, union busting, etc.  The further drop-off for children born in 1980 speaks to the strengthening and consolidation of those dynamics.

american-dream

The income trends highlighted in the figures above are clear and significant, and they point to the conclusion that unless we radically transform our capitalist system, which will require building a movement capable of challenging and overcoming the power of those who own and direct our economic processes, working people in the United States face the likelihood of an ever-worsening future.

Martin Hart-Landsberg, PhD is a professor emeritus of economics at Lewis and Clark College. You can follow him at Reports from the Economic Front.

Originally posted at Scatterplot.

Olympic fever has hit! As we all marvel at the power, precision, and grace of the athletes, a more disturbing commentary has also emerged, one that diminishes women athletes’ accomplishments, defines them by the men around them, places them in tired tropes of sex objects, or infantilizes them as “girls.” Some journalists, in combination with a robust social media discussion, are calling this bad behavior out. But should we be so surprised?

According to past research, no. In our work, we see this as a more pervasive issue, and women’s collegiate coaching is a prime example. When Title IX was enacted in 1972 approximately 90% of women’s teams were coached by women; in 2014 that number dropped to 43%. Women comprise only 23% of head coaching positions. Why are women coaches – especially of women’s teams – being left out? We talked to 9 female and 12 male coaches of women’s and men’s teams and many of their own explanations suggest a view of fundamental and “natural” differences between men and women.

.

Talking to Coaches… Gender Matters

In general, the qualities of sport – competition, confidence, physical strength, aggression – are seen as masculine, while characteristics of cooperation, passivity, and dependency are coded feminine, raising suspicions about women’s capacity to excel. Masculine dominance has helped to define the parameters of what it means to be a coach.

Interestingly, coaching may be seen as an example of conflicting masculine roles. Given the low pay and high time commitment, coaching undermines the traditional male family role as breadwinner. As this male head women’s tennis coach explains,

I’ve been kind of lucky… I didn’t feel like I had to make a certain amount of money, X amount of dollars to be happy. So I was ok with where I was at salary wise… I think that the key to that is having a wife that also works, and that we can still make it happen, and sort of live the way we want to live and be happy.

Many of the men echoed the idea that without a spouse’s support, a coaching career would be difficult. Although respondents all felt women opt out of coaching due to family pressures, none felt that men needed to opt out to support their families. Arguably, the relationship between masculinity and athletics provides men with the social compensation necessary to remain in coaching in a way that does not operate for women.

Especially when asked why women don’t coach men, many of the respondents did not think women would have the strength, athleticism, authority, and leadership abilities to be effective men’s coaches. As a male head men’s soccer coach expresses:

I think the game is slightly different. The understanding of the nuances of the men’s game versus the women’s game… for a female to go into a men’s athletic team and command respect from those guys, it’s difficult. A female wouldn’t be able to step in and play seven versus seven and be able to play at the same level. Not technically, not tactically, I mean simply physically…just the strength factor.

Other arguments highlight the assumed biological connection between men and leadership. A female assistant women’s soccer coach argued that “the leadership gene is much more apparent in guys, it’s much more inherent in them.” Additionally challenging is the perception that taking orders and guidance from a female threatens masculinity and calls into question male superiority in a male dominated field. A former male head golf coach notes,

A woman coach is going to have to work harder to gain respect from a guy player than a male coach will have to work from a female player. … [Individuals are] raised to say if a guy’s leading, you give them a little benefit of the doubt. A woman has to prove herself, and until she does there’s going to be doubt.

By internalizing and enforcing stereotypes a gender pecking-order can be preserved. As this woman, an assistant women’s soccer coach, suggests, socialization improves men’s leadership ability:

When girls are socialized… it’s share, everyone in groups, be nice to everyone; guys are taught much more of competitiveness… a guy leader comes out in a group much easier… because in a girl’s environment it’s no one should be above anyone else… guys and girls are just different. They’re socialized different.

Stereotypes about men’s competitiveness and women’s need for emotional bonding were prevalent, and if these are carried into hiring decisions it is easy to see why male coaches are favored. Yet, if gender differences are so stark, we would expect to see same-sex coaching across the board, instead of the current disparity. Instead, this difference only legitimated women’s absence and was not used to question men’s presence as coaches of women’s teams. None of the women said they wanted to coach men’s teams and nor were they upset at being denied access to these positions. Respondents were more in favor of increasing women coaching women, but did not question or challenge any of the main gender stereotypes. This man, a former head men’s golf coach said,

I’m a fan of a woman coaching women’s sports, if skill levels are equal, because there are certain intangibles – I don’t understand the woman animal as well on certain things.

Shattering the “Glass Wall”?

Coaches we interviewed recognized the role that resources and opportunities played in incentivizing men into coaching women, but none challenged any aspect of the system. Respondents automatically buy into the “glass wall” such that 50 percent of jobs (those coaching men) are off-limits, thus if women coach approximately 50 percent of women’s teams, it’s “fair.” We see that unquestioned assumptions of gender difference supported perceptions that masculinity and men were superior to femininity and women. Twenty years ago scholars on this topic said it is beliefs in male athletic superiority that justify gender disparities in coaching, and according to these interviews little has changed. So, yes, observers should continue to call out the failures of Olympic commentators to treat women athletes equally, but as we say goodbye to Rio, let’s not forget how these issues are shaping coaches’ and athletes’ experiences every day.

Catherine Bolzendahl is a professor of sociology and the co-author of Counted Out: Same Sex Relations and Americans’ Definitions of Family. Vanessa Kauffman is a PhD student.  Both are at the University of California, Irvine. Jessica Broadfoot-(Lee) is an alum and was a member of the women’s tennis team and a two-time Big West Scholar-Athlete..

Wealth inequality in the U.S. is extreme, but global wealth inequality, illustrates a video by The Rules, is even more stunning. Some facts:

  • The top 20% control 80% of the world’s wealth.
  • The richest 2% control more wealth than the bottom half of the world’s population.
  • The richest 300 people on earth have more wealth than the poorest 3,000,000,000.
  • 200 years ago, rich countries were three times as rich as poor countries. Today, they are eighty times richer.
  • Rich countries give $130 billion dollars worth of aid to poor countries every year, but they extract $2 trillion each year thanks to global economic rules.

Here are their sources; or watch the four minute video:

The Rules wants to reveal and challenge the laws that govern our global economy. It is a distinctly sociological project, looking at how factors outside of individuals — or, in this case, countries — shape lives. Shaped strongly by the richest countries in their own best interest, rules governing the trading of goods and money are determining the economic solvency and future of countries.

When those rules are invisible, it can seem like struggling countries are just poorly managed or culturally problematic when, in fact, the rules ensure that the deck is stacked against them.

Hat tip to Martin Hart-Landsberg.Lisa Wade, PhD is an Associate Professor at Tulane University. She is the author of American Hookup, a book about college sexual culture; a textbook about gender; and a forthcoming introductory text: Terrible Magnificent Sociology. You can follow her on Twitter and Instagram.

I’m on a plane right now, flying from Sacramento back to Albany. And sitting here I’m reminded of how air travel itself reflects the growing inequality of society in a trivial, but suggestive, way.

Planes have always had first-class and passenger cabins, at least as far as I know. If the Titanic had this distinction, I’m guessing it was in place from the beginning of commercial aviation.

But for most of my adult life, planes — at least the ones I usually fly on, from one U.S. city to another — looked something like this:

1 (3) - Copy

Just roughing it out here, this means that 7% of the passengers used about 15% of the room, with the other 93% using 85% of the cabin space. Such a plane would have a Gini index of about 8. The Gini index is measure of inequality, a fancy statistical way of representing inequality in the income distribution of a country’s population. For reference, the U.S. Gini is about 48, and the global one is around 65.

Domestic airlines have pretty much moved to a three-tier system now, in which the traditional first-class seating is supplemented by “Economy Plus,” in which you get an extra three or four inches of legroom over the standard “Economy” seats. I, as usual, am crammed into what should really be called “Sardine Class” — where seats now commonly provide a pitch of 31”, a few inches down from what most planes had a decade ago.

In today’s standard U.S. domestic configuration, the 12% of people in first class use about 25% of the passenger space, the 51 people in Economy Plus use another 30%, leaving the sardines — the other 157 people — with 45%. That gives us a Gini index of about 16.

1 (3)

Transatlantic flights, however, are increasingly taking this in-the-air distinction to new heights. Take, for example, the below United configuration of the Boeing 777. It boasts seats that turn into beds on which one can lie fully horizontal. United calls this new section of bed-seats “BusinessFirst.”

1 (4) - Copy

Unsurprisingly, though, these air-beds take up even more space than a nice comfy first class seat. So if we look again at how the space is distributed, we now have 19% of the people using about 35% of the plane, 27% using another 25%, and the final 52% using the last 40%. The Gini index has now increased to 25.

It’s not often you see such a clear visual representation of our collective acceptance of the right of a small fraction of people to consume a very disproportionate percentage of resources. I wonder how much of the shift is actually driven by increased inequality, as opposed to improved capacity for price discrimination.

And it’s also worth noting that the plane above, while unequal relative to the old-fashioned three-rows-of-first-class-and-the-rest-economy layout, is still nowhere near the inequality of the U.S., or the world.

Elizabeth Popp Berman, PhD is an associate professor of sociology at the University at Albany.  She is the author of Creating the Market University: How Academic Science Became an Economic Engine and regularly blogs at OrgTheory, where this post originally appeared.

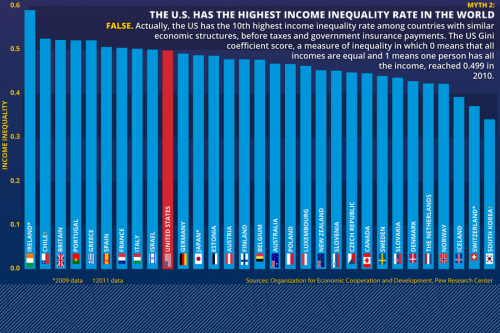
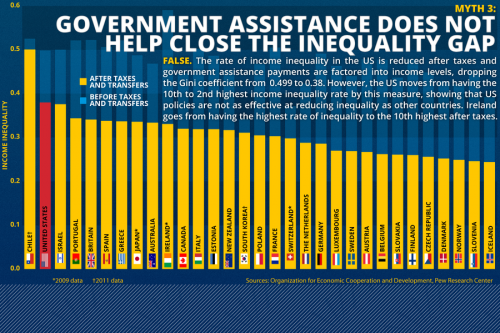
Below are two figures. The first ranks the U.S. and other countries by income inequality before taxes and government interventions to reduce it. The second ranks the same countries after taxes and intervention.

What we see is that, whatever we’re doing to reduce inequality, it’s not working nearly as well as what other countries with high levels of income inequality are doing, with the sole exception of Chile.

1 (3) 1 (4)

Thanks to Christian Science Monitor for the images and Martin Hart-Landsberg for the tip.Lisa Wade, PhD is an Associate Professor at Tulane University. She is the author of American Hookup, a book about college sexual culture; a textbook about gender; and a forthcoming introductory text: Terrible Magnificent Sociology. You can follow her on Twitter and Instagram.

I’d hope that someone who has written a book about “What Shapes Our Fortunes” would have had Sociology 101 where he would have learned the fundamentally different ways that income and wealth work in our economy.  But apparently not.

In Rags to Riches to Rags Again,  Mark Rank writes that because of a great deal of turbulence in household earning over a lifetime “we have much more in common with one another than we dare to realize.”

One of the reasons for such fluidity at the top is that, over sufficiently long periods of time, most American households go through a wide range of economic experiences, both positive and negative. Individuals we interviewed spoke about hitting a particularly prosperous period where they received a bonus, or a spouse entered the labor market, or there was a change of jobs. These are the types of events that can throw households above particular income thresholds.

Ultimately, this information casts serious doubt on the notion of a rigid class structure in the United States based upon income. It suggests that the United States is indeed a land of opportunity, that the American dream is still possible — but that it is also a land of widespread poverty. And rather than being a place of static, income-based social tiers, America is a place where a large majority of people will experience either wealth or poverty — or both — during their lifetimes.

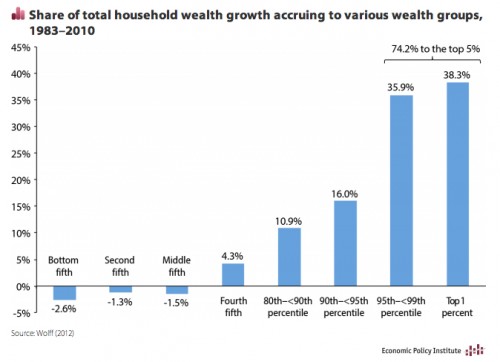
All together now:  Income, that comes in *household* paychecks, regardless of how many earners are contributing to that household income, is not wealth.  Wealth is how much money a household has in the bank and in investments and the assets they own, like real estate, businesses, land, cars, boats, and planes.

Wealth inequality is much greater than income inequality. It looks like this:

1

And breaking it down by race:

1

It is no small thing for any household to attain an annual income of a million dollars for even one year.

But it is an entirely different experience to have enough wealth that one can no longer worry about income at all, can work the tax system to mask enormous amounts of income,  can essentially withdraw from everyday contact with everyday Americans, can use one’s wealth to leverage political and economic power, and can know that the children in one’s household will never, ever want for a thing.

The “1%” was never about income alone.

Jane Van Galen, PhD, is a professor of education at the University of Washington, Bothell.  Her research focus is on socioeconomic class, education, and digital media. She writes for Education and Class, where this post originally appeared.