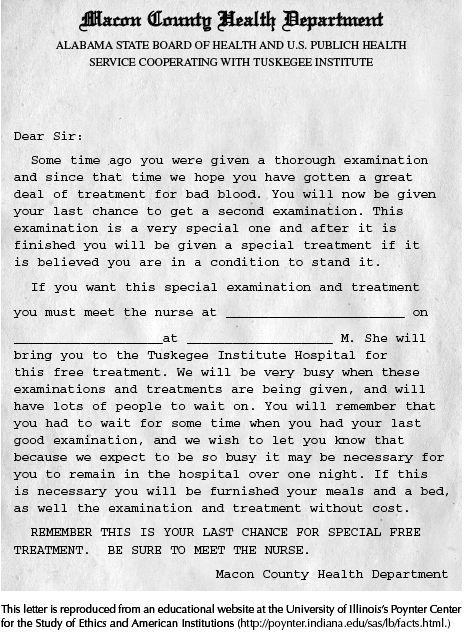
Search results for alabama

Over the last few weeks, commentary about alleged sexual predator Roy Moore’s failure to secure a seat in the U.S. Senate has flooded our news and social media feeds, shining a spotlight on the critical role of Black women in the election. About 98% of Black women, comprising 17% of total voters, cast their ballots for Moore’s opponent Doug Jones, ensuring Jones’s victory. At the same time, commentators questioned the role of White women in supporting Moore. Sources estimate that 63% of White women voted for Moore, including the majority of college-educated White women.

Vogue proclaimed, “Doug Jones Won, but White Women Lost.” U.S. News and World Reports asked, “Why do so many White women vote for misogynists?” Feminist blog Jezebel announced succinctly: “White women keep fucking us over.” Fair enough. But we have to ask, “What about Black and White men?” The fact that 48% of Alabama’s voting population is absent from these conversations is not accidental. It’s part of an incomplete narrative that focuses solely on the impact of women voters and continues the false narrative that fixing inequality is solely their burden.

Let’s focus first on Black men. Exit poll data indicate that 93% of Black men voted for Jones, and they accounted for 11% of the total vote. Bluntly put, Jones could not have secured his razor-thin victory without their votes. Yet, media commentary about their specific role in the election is typically obscured. Several articles note the general turnout of Black voters without explicitly highlighting the contribution of Black men. Other articles focus on the role of Black women exclusively. In a Newsweek article proclaiming Black women “Saved America,” Black men receive not a single mention. In addition to erasing a key contribution, this incomplete account of Jones’s victory masks concerns about minority voter suppression and the Democratic party taking Black votes for granted.

White men comprised 35% of total voters in this election, and 72% of them voted for Moore. But detailed commentary on their overwhelming support for Moore – a man who said that Muslims shouldn’t serve in Congress, that America was “great” during the time of slavery, and was accused of harassing and/or assaulting at least nine women in their teens while in his thirties – is frankly rare. The scant mentions in popular media may best be summed up as: “We expect nothing more from White men.”

As social scientists, we know that expectations matter. A large body of work indicates that negative stereotypes of Black boys and men are linked to deleterious outcomes in education, crime, and health. Within our academic communities we sagely nod our heads and agree we should change our expectations of Black boys and men to ensure better outcomes. But this logic of high expectations is rarely applied to White men. The work of Jackson Katz is an important exception. He, and a handful of others have, for years, pointed out that gender-blind conversations about violence perpetrated by men, primarily against women – in families, in romantic relationships, and on college campuses – serve only to perpetuate this violence by making its prevention a woman’s problem.

The parallels to politics in this case are too great to ignore. It’s not enough for the media to note that voting trends for the Alabama senate election were inherently racist and sexist. Pointing out that Black women were critically important in determining election outcomes, and that most White women continued to engage in the “patriarchal bargain” by voting for Moore is a good start, but not sufficient. Accurate coverage would offer thorough examinations of the responsibility of all key players – in this case the positive contributions of Black men, and the negative contributions of White men. Otherwise, coverage risks downplaying White men’s role in supporting public officials who are openly or covertly racist or sexist. This perpetuates a social structure that privileges White men above all others and then consistently fails to hold them responsible for their actions. We can, and must, do better.

Mairead Eastin Moloney is an Assistant Professor of Sociology at the University of Kentucky. 

In February of 1926, Carter G. Woodson helped establish “Negro History Week” to educate teachers, students, and community members about the accomplishments and experiences of Blacks in the United States. A native of Virginia, and the son of formerly enslaved parents, Woodson earned a PhD in history from Harvard University, and dedicated much of his life to writing and teaching about information largely omitted from textbooks and other historical accounts. Although Woodson died in 1950, his legacy continues, as “Negro History Week” eventually became “Black History Month” in 1976.

Nearly a century later, Black History is still at risk of erasure, especially in (once) geographically isolated areas, like Appalachia. The standard narrative that Scots-Irish “settled” Appalachia starting in the 18th century hides the fact that there were often violent interactions between European immigrants and indigenous people in the region. Even in the 1960s when authors like Michael Harrington and Harry Caudill reported on Appalachian mountain folk, the people were depicted as Scots-Irish descendants, known for being poor, lazy, and backward, representations that are reinforced in contemporary accounts of the region, such as J. D. Vance’s wildly popular memoir Hillbilly Elegy.

Source: Wikimedia Commons

Accounts like these offer stereotypical understandings of poor Appalachian whites, and at the same time, they ignore the presence and experiences of Blacks in the region. Work by social scientists William Turner and Edward Cabell, as well as “Affrilachia” poet Frank X. Walker, and historian Elizabeth Catte attempts to remedy this problem, but the dominant narrative of the region centers still on poor whites and their lives.

Work I have been doing documenting the life experiences of Leslie [“Les”] Whittington, a native of Western North Carolina and a descendent of a formerly enslaved people, has opened my eyes to a historical narrative I never fully knew. African Americans, for instance, accounted for approximately 10% of the Appalachian region’s population by 1860, and many were enslaved, including Les’ grandfather, John Myra Stepp. Yet, their stories are glaringly missing from the dominant narrative of the region.

Source: Appalachian Regional Commission Census Data Overview

So too are the stories of Blacks living in Appalachia today. Even though the number of African American residents has increased in some parts of  Appalachia, while the white population has decreased, little is formally documented about their lives. That absence has led scholar William Turner, to refer to Blacks in Appalachia as a “racial minority within a cultural minority.” Not only does erasing African Americans from the past and present of Appalachia provide an inaccurate view of the region, but it also minimizes the suffering of poor Blacks, who relative to their white counterparts, are and have been the poorest of an impoverished population.

Woodson established “Negro History Week” to document and share the history of Blacks in the United States, recognizing that, “If a race has no history, it has no worthwhile tradition, it becomes a negligible factor in the thought of the world, and it stands in danger of being exterminated.” The history of African Americans in the Appalachian region is largely absent from the area’s official record, and without making it part of the dominant narrative, we risk losing that history.

Jacqueline Clark, PhD is a professor of sociology at Ripon College. Her teaching and research interests include social inequalities, the sociology of health and illness, and the sociology of jobs and work. 

I love gender and sexual demography.  It’s incredibly important work.  Understanding the size and movements of gender and sexual minority populations can help assess what kinds of resources different groups might require and where those resources would be best spent, among others things.  Gary J. Gates and Frank Newport initially published results from a then-new Gallup question on gender/sexual identity in 2012-2013 (here).  At the time, 3.4% of Americans identified as either lesbian, gay, bisexual, or transgender.  It’s a big deal – particularly as “identity” is likely a conservative measure when it comes to assessing the size of the population of LGBT persons.  After I read the report, I was critical of one element of the reporting: Gates and Newport reported proportions of LGBT persons by state.  As data visualizations go, I felt the decision concealed more than it revealed.

From 2015-2016, Gallup collected a second round of data. These new data allowed Gates to make some really amazing observations about shifts in the proportion of the U.S. population identifying themselves as LGBT.  It’s a population that is, quite literally on the move.  I posted on this latter report here.  The shifts are astonishing – particularly given the short period of time between waves of data collection.  But, again, data on where LGBT people are living was reported by state.  I suspect that much of this has to do with sample size or perhaps an inability to tie respondents to counties or anything beyond state and time zone.  But, I still think displaying the information in this way is misleading.  Here’s the map Gallup produced associated with the most recent report:

During the 2012-2013 data collection, Hawaii led U.S. states with the highest proportions of LGBT identifying persons (with 5.1% identifying as LGBT)–if we exclude Washington D.C. (with 10% identifying as LGBT).  By 2016, Vermont led U.S. states with 5.3%; Hawaii dropped to 3.8%.  Regardless of state rank, however, in both reports, the states are all neatly arranged with small incremental increases in the proportions of LGBT identifying persons, with one anomaly–Washington D.C.  Of course, D.C. is not an anomaly; it’s just not a state. And comparing Washington D.C. with other states is about as meaningful as examining crime rate by European nation and including Vatican City.  In both examples, one of these things is not like the others in a meaningful sense.

In my initial post, I suggested that the data would be much more meaningfully displayed in a different way.  The reason D.C. is an outlier is that a good deal of research suggests that gender and sexual minorities are more populous in cities; they’re more likely to live in urban areas.  Look at the 2015-2016 state-level data on proportion of LGBT people by the percentage of the state population living in urban areas (using 2010 Census data).  The color coding reflects Census regions (click to enlarge).

Vermont is still a state worth mentioning in the report as it bucks the trend in an impressive way (as do Maine and New Hampshire).  But I’d bet you a pint of Cherry Garcia and a Magic Hat #9 that this has more to do with Burlington than with thriving communities of LGBT folks in the towns like Middlesex, Maidstone, or Sutton.

I recognize that the survey might not have a sufficient sample to enable them to say anything more specific (the 2015-2016 sample is just shy of 500,000).  But, sometimes data visualizations obscure more than they reveal.  And this feels like a case of that to me.  In my initial post, I compared using state-level data here with maps of the U.S. after a presidential election.  While the maps clearly delineate which candidate walked away with the electoral votes, they tell us nothing of the how close it was in each state, nor do they provide information about whether all parts of the state voted for the same candidates or were regionally divided.  In most recent elections traditional electoral maps might leave you wondering how a Democrat ever gets elected with the sea of red blanketing much of the nation’s interior.  But, if you’ve ever seen a map showing you data by county, you realize there’s a lot of blue in that red as well–those are the cities, the urban areas of the nation.  Look at the results of the 2016 election by county (produced by physicist Mark Newman – here).  On the left, you see county level voting data, rather that simply seeing whether a state “went red” or “went blue.”  On the right, Newman uses a cartogram to alter the size of each county relative to its population density.  It paints a bit of a different picture, and to some, it probably makes that state-level data seem a whole lot less meaningful.

Maps from Mark Newman’s website: http://www-personal.umich.edu/~mejn/election/2016/

The more recent report also uses that state-level data to examine shifts in LGBT identification within Census regions as well.  Perhaps not surprisingly, there are more people identifying as LGBT everywhere in the U.S. today than there were 5 years ago (at least when we ask them on surveys).  But rates of identification are growing faster in some regions (like the Pacific, Middle Atlantic, and West Central) than others (like New England).  Gates suggests that while this might cause some to suggest that LGBT people are migrating to different regions, data don’t suggest that LGBT people are necessarily doing that at higher rates than other groups.

The recent shifts are largely produced by young people, Millennials in the Gallup sample.  And those shifts are more pronounced in those same states most likely to go blue in elections.  As Gates put it, “State-level rankings by the portion of adults identifying as LGBT clearly relate to the regional differences in LGBT social acceptance, which tend to be higher in the East and West and lower in the South and Midwest. Nevada is the only state in the top 10 that doesn’t have a coastal border. States ranked in the bottom 10 are dominated by those in the Midwest and South” (here).

When we compare waves of data collection, we can see lots of shifts in the LGBT-identifying population by state (see below; click to enlarge).  While the general trend was for states to have increasing proportions of people claiming LGBT identities in 2015-2016, a collection of states do not follow that trend.  And this struck me as an issue that ought to provoke some level of concern.  Look at Hawaii, Rhode Island, and South Dakota, for example.  These are among the biggest shifts among any of the states and they are all against the liberalizing trend Gates describes.

Presentation of data is important.  And while the report might help you realize, if you’re LGBT, that you might enjoy living in Vermont or Hawaii more than Idaho or Alabama if living around others who share your gender or sexual identity is important to you, that’s a fact that probably wouldn’t surprise many.  I’d rather see maps illustrating proportions of LGBT persons by population density rather than by state.  I don’t think we’d be shocked by those results either.  But it seems like it would be provide a much better picture of the shifts documented by the report than state-level data allow.

Tristan Bridges, PhD is a professor at the University of California, Santa Barbara. He is the co-editor of Exploring Masculinities: Identity, Inequality, Inequality, and Change with C.J. Pascoe and studies gender and sexual identity and inequality. You can follow him on Twitter here. Tristan also blogs regularly at Inequality by (Interior) Design.

2 (1)“It is fair to say,” writes historian Heather Williams about the Antebellum period in America, “that most white people had been so acculturated to view black people as different from them that they… barely noticed the pain that they experienced.”

She describes, for example, a white woman who, while wrenching enslaved people from their families to found a distant plantation, describes them as “cheerful,” in “high spirits,” and “play[ful] like children.” It simply never occurred to her or many other white people that black people had the same emotions they did, as the reigning belief among whites was that they were incapable of any complex or deep feeling at all.

It must have created such cognitive dissonance, then — such confusion on the part of the white population — when after the end of slavery, black people tried desperately to reunite with their parents, cousins, aunties and uncles, nieces and nephews, spouses, lovers, children, and friends.

And try they did. For decades newly freed black people sought out their loved ones. One strategy was to put ads in the paper. The “Lost Friends” column was one such resource. It ran in the Southwestern Christian Advocate from 1879 until the early 1900s and a collection of those ads — more than 330 from just one year — has been released by the Historic New Orleans Collection. Here is an example:

4

The ads would have been a serious investment. They cost 50 cents which, at the time, would have been more than a day’s income for most recently freed people.

Williams reports that reunions were rare. She excerpted this success story from the Southwestern in her book, Help Me To Find My People, about enslaved families torn asunder, their desperate search for one another, and the rare stories of reunification.

A FAMILY RE-UNITED

In the SOUTHWESTERN of March 1st, we published in this column a letter from Charity Thompson, of Hawkins, Texas, making inquiry about her family. She last heard of them in Alabama years ago. The letter, as printed in the paper was read in the First church Houston, and as the reading proceeded a well-known member of the church — Mrs. Dibble — burst into tears and cried out “That is my sister and I have not seen her for thirty three years.” The mother is still living and in a few days the happy family will once more re-united.

I worry that white America still does not see black people as their emotional equals. Psychologists continue to document what is now called a racial empathy gap, both blacks and whites show lesser empathy when they see darker-skinned people experiencing physical or emotional pain. When white people are reminded that black people are disproportionately imprisoned, for example, it increases their support for tougher policing and harsher sentencing. Black prisoners receive presidential pardons at much lower rates than whites. And we think that black people have a higher physical pain threshold than whites.

How many of us tolerate the systematic deprivation and oppression of black people in America today — a people whose families are being torn asunder by death and imprisonment — by simply failing to notice the depths of their pain?

Lisa Wade, PhD is an Associate Professor at Tulane University. She is the author of American Hookup, a book about college sexual culture; a textbook about gender; and a forthcoming introductory text: Terrible Magnificent Sociology. You can follow her on Twitter and Instagram.

Flashback Friday.

Social and biological scientists agree that race and ethnicity are social constructions, not biological categories.  The US government, nonetheless, has an official position on what categories are “real.”  You can find them on the Census:

These categories, however real they may seem, are actually the product of a long process. Over time, the official US racial categories have changed in response to politics, economics, conflict, and more. Here’s some highlights.

In the year of the first Census, 1790, the race question looked very different than it does today:

Free white males
Free white females
All other free persons (included Native Americans who paid taxes and free blacks)
And slaves

By 1870 slavery is illegal and the government was newly concerned with keeping track of two new kinds of people: “mulattos” (or people with both black and white ancestors) and Indians:

White
Black
Mulatto
Indian (Native Americans)

Between 1850 and 1870 6.5 million Europeans had immigrated and 60,000 Chinese.  Chinese and Japanese were added for the 1880 Census.

By 1890, the U.S. government with obsessed with race-mixing.  The race question looked like this:

White
Black (3/4th or more “black blood”)
Mulatto (3/8th to 5/8th “black blood”)
Quadroons (1/4th “black blood”)
Octoroons (1/8th or any trace of “black blood”)
Indian
Chinese
Japanese

This year was the only year to include such fine-tuned mixed-race categories, however, because it turned out it wasn’t easy to figure out how to categorize people.

In the next 50 years, the government added and deleted racial categories. There were 10 in 1930 (including “Mexican” and “Hindu”) and 11 in 1940 (introducing “Hawaiian” and “Part Hawaiian”).  In 1970, they added the “origin of descent” question that we still see today.  So people are first asked whether they are “Hispanic, Latino, or Spanish” and then asked to choose a race.

You might immediately think, “But what do these words even mean?”  And you’d be right to ask.  “Spanish” refers to Spain; “Latino” refers to Latin America; and “Hispanic” is a totally made up word that was originally designed to mean “people who speak Spanish.”

Part of the reason we have the “Hispanic” ethnicity question is because Mexican Americans fought for it.  They thought it would be advantageous to be categorized as “white” and, so, they fought for an ethnicity category instead of a racial one.

Funny story:  The US once included “South American” as a category in the “origin of descent” question.  That year, over a million residents southern U.S. states, like Alabama and Mississippi checked that box.

2000 was the first year that respondents were allowed to choose more than one race. They considered a couple other changes for that year, but decided against them. Native Hawaiians had been agitating to be considered Native Americans in order to get access to the rights and resources that the US government has promised Native Americans on the mainland. The government considered it for 2000, but decided “no.” And whether or not Arab American should be considered a unique race or an ethnicity was also discussed for that year. They decided to continue to instruct such individuals to choose “white.”

The changing categories in the Census show us that racial and ethnic categories are political categories. They are chosen by government officials who are responding not to biological realities, but to immigration, war, prejudice, and social movements.

This post originally appeared in 2010.

Lisa Wade, PhD is an Associate Professor at Tulane University. She is the author of American Hookup, a book about college sexual culture; a textbook about gender; and a forthcoming introductory text: Terrible Magnificent Sociology. You can follow her on Twitter and Instagram.

From the great documentary, Black Power Mix Tape, Angela Davis puts violence in perspective. She’s being interviewed about the tactics of the Black Panthers. The interviewer asks: “How do you get there? Do you get there by confrontation, violence?” She responds:

Oh, is that the question you were asking?

She smiles to herself.

Because of the way this society’s organized, because of the violence that exists on the surface everywhere. You have to expect that there are going to be such explosions. You have to expect things like that as reactions. If you… if a black person lives in the black community all your life and walks out on the street everyday seeing white policemen surrounding you…

I grew up in Birmingham, Alabama. Some very good friends of mine were killed by bombs, bombs that were planted by racists. I remember from the time I was very small, I remember the sounds of bombs exploding across the street, our house shaking. I remember my father having to have guns at his disposal at all times because of the fact that at any moment someone… we might expect to be attacked.

The… man who was at that time in complete control of the city government… would often get on the radio and make statements like: “Niggers have moved into a white neighborhood. We better expect some bloodshed tonight.” And, sure enough, there would be bloodshed.

In fact, when the bombing occurred one of the mothers of one of the young girls called my mother and said, “Can you take me down to the church to pick up Carol. We heard about the bombing and I don’t have my car.” And they went down and what did they find? They found limbs and heads strewn all over the place.

And then after that, in my neighborhood all of the men organized themselves into an armed patrol. They had to take their guns and patrol our community every night because they did not want that to happen again.

I mean, that’s why when someone asks me about violence, I just…. I just find it incredible. Because what it means is that the person asking that question has no idea what black people have gone through… what black people have experienced in this country since the time the first black person was kidnapped from the shores of Africa.

She’s no longer smiling.

The interchange begins at 1min 40sec:

According to polling by the Public Religion Research Institute, the percent of American who say that the criminal justice system treats black people unfairly rose by 9 percentage points in just one year.  In fact, every category of person polled was more likely to think so in 2014 than in 2013, including Republicans, people over 65, and whites.

The biggest jump was among young people 18-29, 63% of whom believed the criminal justice system was unfair in 2014, compared to 42% in 2016.  The smallest jump was among Democrats — just 3 percentage points — but they mostly thought the system was jacked to begin with.

2

America has a history of making changes once police violence is caught on tape and shared widely. One of the first instances was after police attacked peaceful Civil Rights marchers in Selma, Alabama. The television had just become a ubiquitous appliance and the disturbing images of brutality were hard to ignore when they flashed across living rooms.

The death of Mike Brown in Ferguson, MO, and the aftermath is the likely candidate for this change. If you do a quick Google Image search for the word “ferguson,” the dominant visual story of that conflict seems solidly on the side of the protesters, not the police.

Click to see these images larger and judge for yourself:

2

H/t @seanmcelwee.

Lisa Wade, PhD is an Associate Professor at Tulane University. She is the author of American Hookup, a book about college sexual culture; a textbook about gender; and a forthcoming introductory text: Terrible Magnificent Sociology. You can follow her on Twitter and Instagram.

Flashback Friday.

The Tuskegee Syphilis Experiment is one of the most famous examples of unethical research. The study, funded by the federal government from 1932-1972, looked at the effects of untreated syphilis. In order to do this, a number of Black men in Alabama who had syphilis were misinformed about their illness. They were told they had “bad blood” (which was sometimes a euphemism for syphilis, though not always) and that the government was offering special free treatments for the condition. Here is an example of a letter sent out to the men to recruit them for more examinations:

The “special free treatment” was, in fact, nothing of the sort. The researchers conducted various examinations, including spinal taps, not to treat syphilis but just to see what its effects were. In fact, by the 1950s it was well established that a shot of penicillin would fully cure early-stage syphilis. Not only were the men not offered this life-saving treatment, the researchers conspired to be sure they didn’t find out about it, getting local doctors to agree that if any of the study subjects came in they wouldn’t tell them they had syphilis or that a cure was available.

The abusive nature of this study is obvious (letting men die slow deaths that could have been easily prevented, just for the sake of scientific curiosity) and shows the ways that racism can influence researchers’ evaluations of what is acceptable risk and whose lives matter. The Tuskegee experiment was a major cause for the emergence of human subjects protection requirements and oversight of federally-funded research once the study was exposed in the early 1970s. Some scholars argue that knowledge of the Tuskegee study increased African Americans’ distrust of the medical community, a suspicion that lingers to this day.

In 1997 President Clinton officially apologized for the experiment.

Originally posted in 2009.

Gwen Sharp is an associate professor of sociology at Nevada State College. You can follow her on Twitter at @gwensharpnv.