
Capital punishment in the U.S. has gotten renewed attention recently, with Connecticut’s governor signing a bill repealing the death penalty this week and Californians set to vote on a ballot initiative in November that would get rid of capital punishment in the state.
Think Progress recently reposted a map showing the legality of the death penalty across the U.S. (now out of date since the change in Connecticut), as well as data on the number of people on death row per state (dark red boxes) and the number executed since 1976 (white boxes):
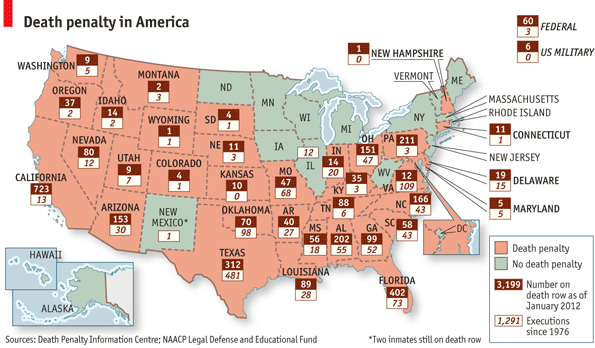
Talking about capital punishment in the U.S. hides a significant amount of variation. While the death penalty is technically available in most states, its use is very uneven. In many states where the death penalty is legal, prosecutors rarely push for it, and the vast majority of death penalty sentences are never actually carried out (for instance, notice that while over 700 people are currently on death row in California, the state has a much lower number of executions since 1976 than many other states). The exception is the South, which accounts for a disproportionate number of death penalty sentences and carries out such sentences at a much higher rate than other states.
In a podcast just posted at Office Hours, David Garland, author of Peculiar Institution: America’s Death Penalty in an Age of Abolition, discusses why capital punishment persists in the U.S. and also highlights the unevenness in its application. It’s a really great summary of the various factors that lead to the patterns we see in the map.
Comments 3
JackPumpkin — April 27, 2012
This ties into other issues people have raised with our sort of federalism. Around 1800, people thought of themselves as citizens of several states under a common constitution. Today, we mostly think of ourselves as Americans who happen to live in one state or the other. There's a sense that basic rights, such as the right not to be put to death by a government worker, should either exist or not exist independently of the state one happens to live in.
Dudley Sharp — September 28, 2012
The 5 Myths of Prof. David Garland – death penaltyDudley Sharp
It is difficult to say if Prof . Garland is just sloppy or if, like many in
academia, he is happy to peddle bias in service of a goal, here, an end to
execution. (“Five myths about the death penalty”, By David Garland,
July 18, 2010, http://www.washingtonpost.com/wp-dyn/content/article/2010/07/16/AR2010071602717.html) Lets’
look at Garland’s myths: 1) Garland fails to mention that it is the
judges that make the imposition of the death penalty all but impossible in some
jurisdictions. Dictatorial judges in New Jersey never allowed an execution.
There, the death penalty was repealed. Pennsylvania judges never allow
executions other than those whereby the inmates waive appeals. If you appeal a
death sentence in Pa, you have a life sentence, even if your death sentence is
not overturned. Similar abusive judicial behavior is legendary in California.
The death penalty in Virginia? Inmates are executed within 7.1 years,
on average, after sentencing, 75% of those sentenced to death have been
executed and only 15% of death row cases are overturned on appeal. The national
averages for those are 11 years, 13% and 37%, respectively. The
difference is in the judges. Victim survivors in death penalty cases are
knowingly and unnecessarily tortured by such irresponsible and callous judges,
as in NJ, Pa and Ca and others, nationwide. Garland gives the false
hope that by replacing the death penalty with a life sentence that we can avoid
these problems. All states are, now, looking at ways to release lifers, early,
for overcrowding and cost issues. Instead of the abusive performance of
judges in so many death penalty jurisdictions, cases, abuse which should be
stopped, those murder victim survivors would then be served a recurring theme of
releasing those lifer murderers of their loved ones. The same legal
challenges that have been used for years to restrict death penalty applications,
are now being repeated in challenging life sentences. Pro death penalty folks
have been stating that pending course for years and it is now in full swing.
Murderers serving life sentences can appeal for life. 2 and 3. Yes,
fortunately, American democracy is stronger. Even in Europe, the collection of
countries whose governments are most opposed to the death penalty, the majority
of their populations do support the death penalty for some crimes (1). Those
governments could care less. It may be the case that a majority of
citizens in every country support executions for some crimes, based upon the
proposition that such sanction is a morally just and proportionate sanction for
the crime(s) committed, the foundation of support for all criminal
sanctions. The insult here is that Garland believes that governments ban
the death penalty because they know better, that they are wiser than those whom
they govern, similar in fashion to the dictatorial judges who confound the law,
as reviewed. In fact, it is simply a product of Garland’s bias, with no evidence
to support it and a false sense of parental superiority guiding it. 4.
Predictably, Garland says “it stretches credulity to think that the death
penalty, as administered in the United States today, can be an effective means
for deterring murder”. Note, that Garland’s hedge is “effective”, which
he can define in any manner he wishes. Of course the death penalty
deters. All prospects of any negative outcome deter some. There is no
exception. Let’s say that only 0.5% of murderers are deterred every year
because of deterrence. It is a very small percentage of murders deterred, but
huge in terms of lives saved, about 90 innocents saved per year, on average,
since 1977, noting an 18,000 murders/yr. average during that time. Is
that effective, enough, for Garland? Probably not. For many against the death
penalty, it wouldn’t matter if a thousand lives were spared per execution
because of deterrence, they would still seek its end. Of the recent
(since 2000) 28 studies finding for deterrence, there is a range of deterrence
detected, between 1 and 28 lives spared per execution (2), with an average of
about 30 executions per year, since 1977, which equates to about 30-900
innocents spared per year because of deterrence. Garland states that “66
percent have their death sentences overturned on appeal or post-conviction
review. He needs to fact check. It is 37%. (3) Garland states that “a
smaller number — 139 — have been exonerated in the past 30 years”. Fact checking
is definitely not Garland’s thing. The 139 exonerated is well known fraud and
easily uncovered by anyone who cared to fact check. (4) 5. Of course
the death penalty works. Everyone who has been executed has remained
dead. Garland states: “An Indiana study last month showed that capital
sentences cost 10 times more than life in prison without parole.” Not
surprisingly, Garland didn’t fact check that story either. It is about 12% more
expensive not the 1000% (10 times) that Garland found. (5) Garland
closes: “Getting past the myths and looking at how the death penalty actually
operates is one place to start. ” How would he know? 1) “Death
Penalty Support Remains Very High: USA & The World”http://prodpinnc.blogspot.com/2009/07/death-penalty-polls-support-remains.html
2) 28 recent studies finding for deterrence, Criminal Justice Legal
FoundationSee Published Research, Working Papers and Essays at http://www.cjlf.org/deathpenalty/dpdeterrencefull.htm 3)
“A Broken Study: A Review of ‘A Broken System’ ”http://prodpinnc.blogspot.com/2009/10/broken-study-review-of-broken-system.html 4)
“The 130 (now 139) death row ‘innocents’ scam”http://homicidesurvivors.com/2009/03/04/fact-checking-issues-on-innocence-and-the-death-penalty.aspx 5)
Garland was referencing a review that didn’t look at all the costs and stated
that it didn’t include all the costs. With one exception, this one appears to.
See Background Information, page 2, Fiscal Impact Statement,
Legislative Services Agency,http://www.in.gov/legislative/bills/2008/PDF/FISCAL/HB1074.004.pdf Costs
per case$758, 243 for death penalty$657, 028 for LWOP However,
this excludes the credit of savings for plea bargain to LWOP, which I suspect
saves at least $20, 000 per case, solely attributed to having the death
penalty. That would bring the differential down to about $80,000 – the
death penalty and LWOP cost amounts are already present valued. $738,
000 for death penalty (inclusive of LWOP plea credit cost savings, solely
attributable to having the death penalty)$657, 000 for LWOP The
death penalty is 12% more than LWOP.
gorilla tag — September 14, 2023
This is an amazing and informative article that covers so much ground.