
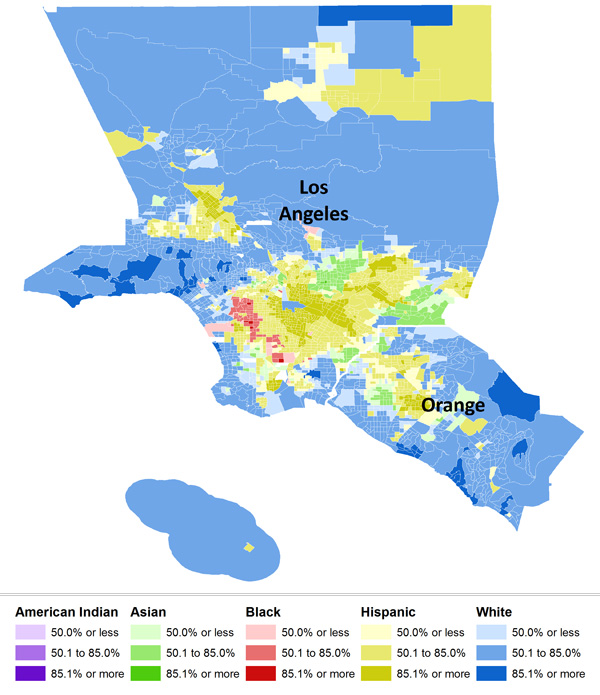
I’m still totally geeking out about the Census Bureau starting to release data from the 2010 Census, so today you’re getting another post based on it. Kristina K. let us know that Salon has up maps of the 10 most racially-segregated metropolitan areas with populations of 500,000+, based on analyses from the University of Michigan’s Population Studies Center and available at CensusScope. Note that in the race categories, Hispanic is presented as a separate category; all other racial groups include only members of that race who said they were not of Hispanic origin. The Population Studies Center also has data available broken down by specific races and at the state level, though they don’t have maps for them, just the raw dissimilarity indices.
Here’s L.A., at #10:
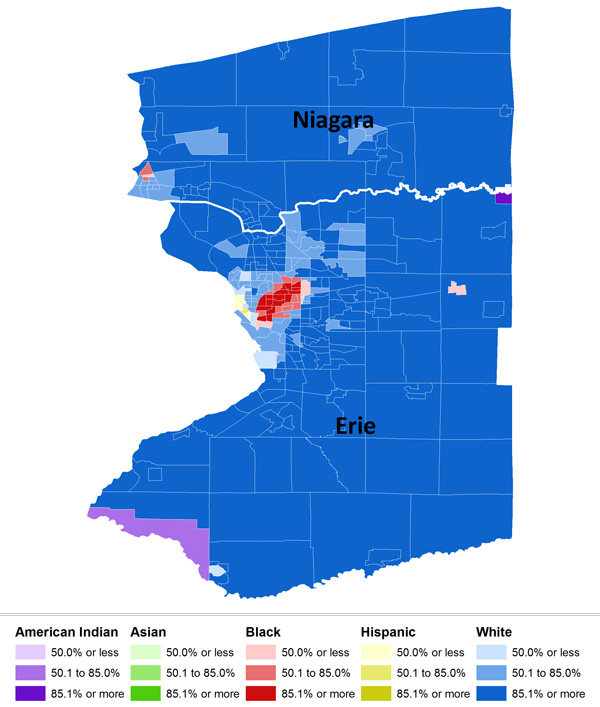
Here, just for my friend Tony, is his hometown of Buffalo, NY, #6 on the list:
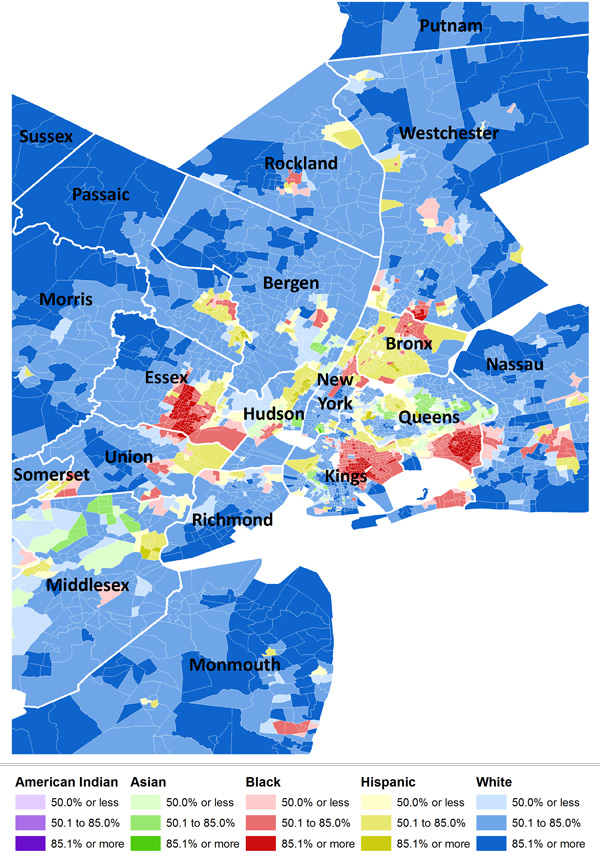
New York comes in second:
The most segregated 500,000+ metro area in the U.S.? Milwaukee:
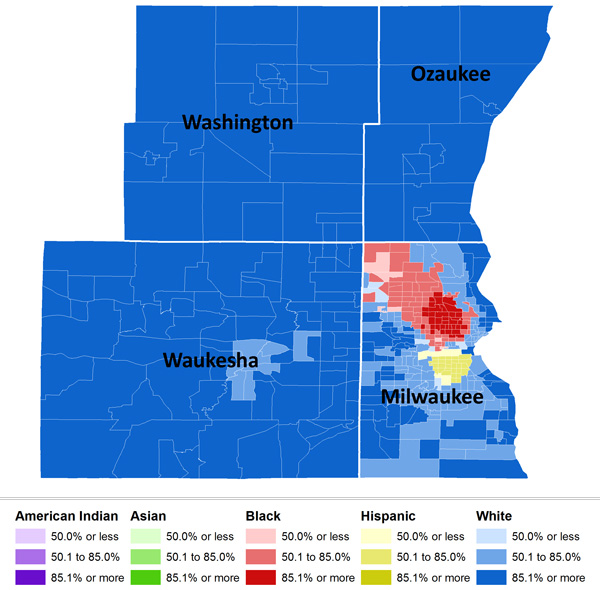
Based on the dissimilarity index, over 81% of Milwaukee’s non-White population would have to relocate to be distributed similarly to Whites.
Interestingly, given assumptions many have about race relations in the U.S., the South doesn’t show up here. St. Louis is the most Southern city in the top 10, which is dominated by cities in the old industrial core of the North and upper Midwest/Great Lakes regions.
Comments 31
Ricky — March 30, 2011
"Interestingly, given assumptions many have about race relations in the U.S., the South doesn’t show up here. St. Louis is the most Southern city in the top 10, which is dominated by cities in the old industrial core of the North and upper Midwest/Great Lakes regions."
That is interesting...if you are a time traveler from the 1960's.
Joe — March 30, 2011
I believe the last point you made about the South was covered in "American Apartheid" by Massey & Denton. I can't exactly reconstruct their analysis, but I believe they said that sharp segregation in the North resulted from push back from the Great Migration.
It's also interesting how the politics of a region and its segregation hardly line up at all. Take the discussion in the Salon piece about Philadelphia: "Discussions about race in Philly are usually met with a deafening backlash from local whites..." That certainly jives with a lot of my experience in the region, but Philadelphia is also as blue a county as they come! It went 98% for Obama, which is impossible without all the whites in the city also voting for him.
Sarah — March 30, 2011
It is interesting given Northerners who've never been to the South's assumptions about the South. An anecdote for anecdote's sake: I dated a man from the South who had relocated to the Pacific Northwest, and one of his greatest complaints about Oregon in particular and the West Coast in general was that his kids might grow up without ever knowing a black person, and often not even seeing one except on TV. I really did think he was nutty, as I'd never been to the South before, and had only learned about the region via history books about slavery, the Civil War and its aftermath. When I visited the region my expectations were reset, although I still don't like pimento cheese.
Umlud — March 30, 2011
It's interesting to me (as a self-identified "multi-racial" person) that the maps don't show multi-racial as an ethnic group.
There is a nation-wide map showing the trends of people self-reporting as multi-racial (http://www.censusscope.org/us/map_multiracial.html).
It's an interesting counterpoint to the ideas of race-as-identity, since many people in the United States are likely to be "multi-racial" (depending upon how one measures race). Is a person who identifies him/herself as "African American" actually "multi-racial" if he/she has a non-African-American parent or grandparent? Or is one's race only what one identifies it to be, or is it what the population says that the person is?
In other words:
* is Barack Obama multi-racial? African American? White?
* is Tiger Woods multi-racial? African American? Asian American?
Furthermore, the question of immigrant communities raise different topics of race. Is a community of Somali refugees (for example) to be considered the same as African Americans? What about a community of Latin American immigrants; are they socially the same "Hispanic" as those whose ancestors lived in the US West prior to their annexation? I would argue that, no, they aren't.
Such concerns of definition of race raise (in my mind) the danger of equating all members of our culturally defined racial contexts. Those who self-identify as race X, but who come from multi-racial homes, may well act differently than those who don't. (In other words, how much of visualization of racial patterns due to self-identification due to historical norms; which may be mitigated if one changed/moderated the definition of race?) Furthermore, immigrant communities may well have a tendency of sticking together; a form of self-imposed segregation, which would necessitate someone to think differently about how one interprets the data. (In other words, are refugees and immigrant communities in one part of a city built out of a sense of community, or because they are not allowed to live anywhere else?)
All this is not to say that there aren't serious social justice problems associated with racial (and cultural) segregation. However, I would argue that the use of a rather limited set of racial groups does not adequately capture the panoply of what is socially occurring in the US, especially as you move out of the strong (historical) black-white racial landscape to include broad-based racial groups that encompass other ancestral nationalities that are unified under a somewhat arbitrary (and often overly broad) classification. If the US is going to continue using race as a social organizing mechanism, I believe that it will be necessary to provide a greater degree of resolution.
Marc — March 30, 2011
The discussion in the Slate article that accompanies each piece is interesting. On one hand, the descriptions of some of the overt things that were done mostly by ethnic whites pre-1960 in Northern cities really are eye-popping. Walls built to separate neighborhoods, mob violence, burning out black residents, etc.
On the other hand, the quotations from academics concerning current population changes struck me a unconscionably lazy. There seems to be a narrative at work that white discomfort with people of color (any color, apparently) is the only data necessary to explain migrations. People make the decision to pull up stakes and move for all sorts of complicated reasons, and I suspect that spying a black family moving in down the block is one reason whose importance (by itself) is falling with time. People will always chase bigger yards, better schools, safer neighborhoods, and lower taxes, and will do so regardless of the racial makeup of where they are going and where they are leaving.
Marc — March 30, 2011
Also interesting: the "Top Ten" that Slate put together is a ranking of Black-White segregation. You can see rankings for other modes of segregation on the U of M site like White-Hispanic, and White-Asian. Now that Blacks and Hispanics are in roughly equal proportion in the US, it will be interesting to see how long the default measure of all things racial continues to be white-black.
Michele — March 30, 2011
White male boyfriend who grew up in affluent, very white suburb in Northern CA made a comment the other day about how whites are no longer the majority It wasn't in a complaining "poor me" way, but a comment on a longer conversation, so I replied, Yeah, but the power is still in the old white boys clubs and they aren't going down without a fight. Therefore it is still necessary to question everything and force people to consider whether the decisions they make in hiring, enrolling, selling, buying, etc. are racially biased. These maps seem to indicate that we really do have a long way to go. It's rather sad.
Racial Segregation – A Living Legacy | Schooling Inequality — March 30, 2011
[...] saw this report posted at Sociological Images this morning and it set my mind on a wandering about housing segregation and the [...]
SPS — March 30, 2011
At a lecture last week by Dr. Thomas J. Sugrue, historian and author of "The Origins of the Urban Crisis" and "Sweet Land of Liberty," one reason for the sharp racial segregation that exists today in northern cities was Brown v. Board.
Northern cities tended to have large, sprawling suburbs which were a different school district than the inner city, while southern cities (Atlanta excepted) tended to have the entire city, including suburbs, under the same municipal school district.
When Brown and subsequent legislation made it illegal to segregate school and gerrymander school zones to "integrate on paper," the resultant white flight led to massive migration of whites in the north from the cities to the suburbs. In the south this was less worthwhile because it didn't solve the problem of keeping their white kids away from black kids in school.
Another great book on the topic is Kevin M. Kruse's "White Flight"
George — March 30, 2011
Since there seems to be a normative argument here, I wanted to point out that Schelling showed in the 70's that even a small preference for being in a neighborhood with people of the same ethnic background would lead to "segregation" due to the inherent positive feedback. Since even a small preference causes segregation, it is not necessarily the result of racism, nor is it particularly surprising that it occurs. Although of course it can lead to many social consequences.
Dave — March 30, 2011
The New York Times site has a little better representation, even though it is an older version of the census, 2005-09. You can also search the entire US. http://projects.nytimes.com/census/2010/explorer?ref=us
Jen — March 30, 2011
I would really like to see this type of data and insight on the least racially-segregated metropolitan areas. I think the ability to contrast the racial histories of these different areas would be fascinating and incredibly revealing.
Jen — March 31, 2011
I live in Milwaukee. I used to live in Texas. When I lived in Texas, I heard a lot of what I will call "overt racism." As in, "don't you have it when black people do that." On the other hand, in the Midwest, what I hear more of is "covert racism."
For instance, I am white but live in a predominately black neighborhood in Milwaukee - sort of the eastern end of that bright red blob on the map. I CONSTANTLY am hearing from white coworkers and classmates about how "that's not the best area, is it?" and "do you feel safe walking around?" and "I can't believe you can keep CDs out in the open inside your car!" Seriously. People say this.
I've heard that incoming students to my university are actually told they shouldn't live in my neighborhood, but rather in the white, upper middle class suburb across the river. That suburb is on the same bus line as mine. Several times I have had a bus driver stop the bus after we've crossed the river, turn around and say something like, "I'm sorry honey, did I miss your stop?"
It's also worth noting that Scott Walker's budget cuts, to public schools, transportation, etc., are aimed predominately at cities like Milwaukee, Racine, Kenosha and Beloit. Cities that just HAPPEN to have the only significant black populations in the state.
CG — March 31, 2011
These analyses really are picking up the extent to which non-whites live in outer-ring suburbs,
because they calculate the dissimilarity index on entire metropolitan areas, using townships as units of analysis.
So at a neighborhood or city level, southern cities may be just as segregated as non-southern cities. But southern extraurban areas have many blacks, while extraurban areas in the Southwest/West have relatively high Hispanic populations.
So again, this analysis is not ranking cities by how likely it is that blacks and whites might be neighbors. It's basically ranking cities by how white the outer-ring suburbs are. For obvious historical reasons, the north has whiter suburbs than the south or the southwest.
Oyveh — April 1, 2011
The example of the Greater Buffalo area is spot-on. I lived in that area - outside of the city, you never see any people but white people, unless you're at one of the local malls that have bus service to and from the city. And even then, usually only around big commerical holidays. It's amazingly racially segregated and it's because of the terrible economic situation in that area.
What the heck is institutional racism? | Erin V Echols — February 27, 2012
[...] problems and the continued “white flight” that occurs because of racial prejudice, residential segregation still continues today. And, because neighborhood determines the school you attend, schools in segregated neighborhoods of [...]
Anti-Hunger and Opportunity Corps — April 3, 2013
[...] According to the 2010 U.S. Census, Buffalo, my city of service and my hometown, was ranked the sixth most segregated city in the nation. In turn, schools are highly segregated, making it so that many children spend their entire [...]
Sociological Images Course Guide: Asian Americans and Pacific Islanders : Asian-Nation : Asian American News, Issues, & Current Events Blog — April 16, 2013
[...] 2010 Census Data on Residential Segregation [...]
Samuel Maltby — August 12, 2022
Genuinely had a common experience examining their articles and these all are unreasonably close to perfection and they have a fantastic impulse. Furthermore, I think this https://keepcalms.com/p/keep-calm-and-design-buildings/ site can assist you with working on the nature of your work. For sure, even this article rouses me towards my business, and this association worth being at the top since they have staggering inspiration.