
Via Shamus Khan, I found the Economic Policy Institute’s interactive graph that lets you see which Americans have earned most of the growth (or, more recently, suffered the losses) in U.S. incomes over time, based on IRS data (and reported in constant 2008 dollars):

You can select beginning and ending points and find out how incomes changed during that period and how the growth was distributed. For instance, the increase in average incomes between 1950 and 1960 were widely distributed:

If we look at the 10-year span between 1995 and 2005, the increase was much more concentrated among the very wealthy:

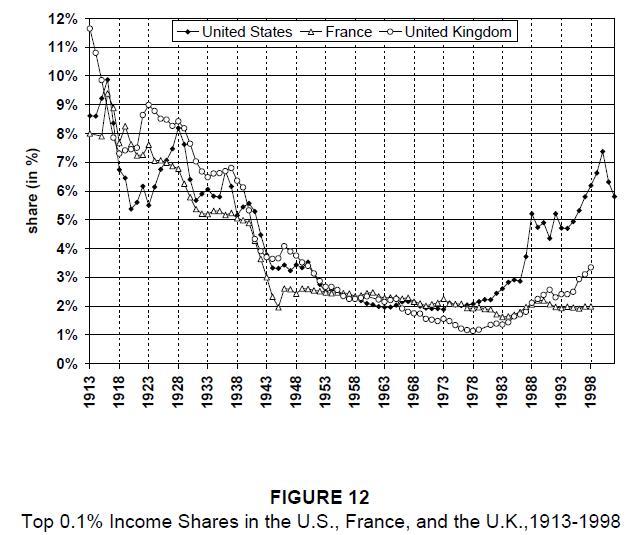
The data come from a study on historical income in equality in the U.S. by economists Thomas Piketty and Emmanuel Saez. They compare the share of income earned by the richest 0.1% of earners in the U.S., France, and the U.K.:
Comments 6
AlgebraAB — February 22, 2011
Very interesting ... however, am I correct in assuming that these income figures are not adjusted for inflation?
I think these figures would have been much more valuable if they were adjusted for inflation. The relative strength of the dollar plays an immense role in determining the purchasing power of an individual or household. I'm also curious about the role of debt/financing. My understanding is that debt has become more widely available in American society in the past several decades and in greater amounts. That certainly plays an important role in determining how these relative income amounts correlate to actual lifestyles.
As for the widening gap between the top 1% (to 5%) and everybody else ... I actually don't attribute it (solely) to tax policy as some economists like Robert Reich tend to. I think there are deeper, far more inconvenient, structural problems with the American economy. In particular, I would key in on the 1985/1986 era when the FIRE (finance, insurance, real estate) sector surpassed the manufacturing/industrial sector in regard to value added to the national GDP. Quite simply, earnings in the FIRE sector of the economy are much more stratified than in industrial manufacturing for obvious reasons: it's usually the capital investment that generates returns, not manpower. Yet, this is now the leading sector of the US economy and one of the few that is growing. I think tax policy plays a much more important role here. Forget the phony war over the Bush tax cuts, the fact that manufacturing enterprises pay a higher tax rate than the capital gains generated by the rentier class is really what is debilitating our economy and powering our trade deficit.
The other issue I would key in on would be the Federal Reserve's interest rate policy. Historically, "middle class" status in the U.S. was usually achieved through saving and a very few key investments (house, car, college education). Nowadays, the Fed is essentially waging a war against savers. It's speculative investments in securities (and in foreign currencies) that are generating returns thanks to our easy money policies. Simple saving is a losing battle when inflation is eroding away gains constantly. Our easy money policy has also transformed the real estate market (probably the biggest bulwark of middle class investment) into its own speculative market - which has made even that avenue of investment far too unpredictable.
lsmsrbls — February 22, 2011
"Via Shamus Khan, I found the Economic Policy Institute’s interactive graph that lets you see which Americans have earned most of the growth (or, more recently, suffered the losses) in U.S. incomes over time, based on IRS data (and reported in constant 2008 dollars)"
theBlackSquirrel — February 22, 2011
I watched a PBS documentary on Richard Nixon last night, so perhaps my mind wanders down a random way of thinking because of my recent memory, but I'm curious about the years selected.
The time frame from 1950 to 1960 seems to include the Korean War (for three years early in the decade), general Communist vs. Western nations discomfort, and the opening period of the Vietnam War. Perhaps I am not aware, but I'm not familiar with whatever economic boom would have occurred in these years.
Then, the period from 1995 to 2005 squares nicely with the internet dot.com bubble. I'm sure a lot of people got rich from that - and potentially lost a lot of money. Maybe investments, too. More to the point, however, is I wonder what affect the start of the Iraq War would have on the data.
Does war increase the income of key players, or does it fit with the Keynesian theory that any government spending stimulates the economy in some way? The government has to buy a lot of things to fight a war. Was conflict in the 50s less capital/manpower intensive? Meaning the government didn't hire large contracting firms to supply goods? If the Iraq War was a larger scale operation, then wouldn't additional income go to highly skilled labor like contractors, consultants, and new federal staff.
Or is the graph just a way to show that the 2001 and 2003 tax cuts were concentrated on high earners?
In any case, I like to be optimistic about the future and all the new innovations it holds.
Waiting Room Reading- 2/27 « Welcome to the Doctor's Office — February 27, 2011
[...] INTERACTIVE GRAPH OF HISTORICAL INCOME GAINS by Gwen Sharp, [...]
Pushing Back at the Greedfest | MASSunderstanding — June 25, 2014
[…] inequality that prevails in contemporary America. Take a look at the disturbing data (here and here), documenting the extent of the inequality and the rate of change over […]