
Rachel F. sent in a link to a site sponsored by the National Center for Culturally Responsive Educational Systems that provides a lot of information on rates of children diagnosed as in need of special education services, broken down by race. For instance, this map shows the proportion of African-Americans aged 6-21 who qualified for special ed services in 2006-2007 for all disabilities (you can also select a specific disability). The states are arranged into quintiles (so each color includes 20% of the states):

I always prefer to know the exact percentages, so I clicked on the Tables tab at the top of the page and looked at the Special Education Rates by Race and Disability link. Here are the percentages for the map above (just the first page of the table):

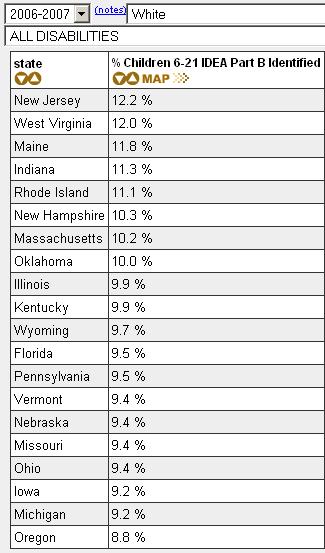
Here’s the equivalent data for Whites (again, page 1 of the table):
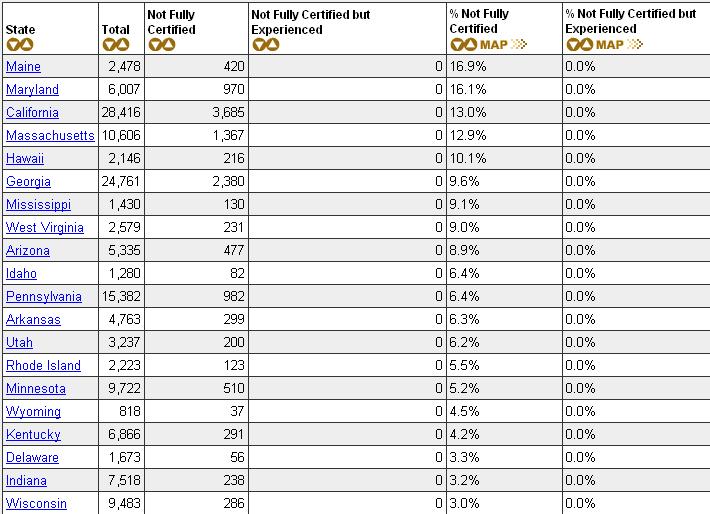
The site also provides info on teacher certification (look under the Tables tab). Here’s page 1 of a table of the states ranked by the % of special-ed teachers who are not fully certified in special education:
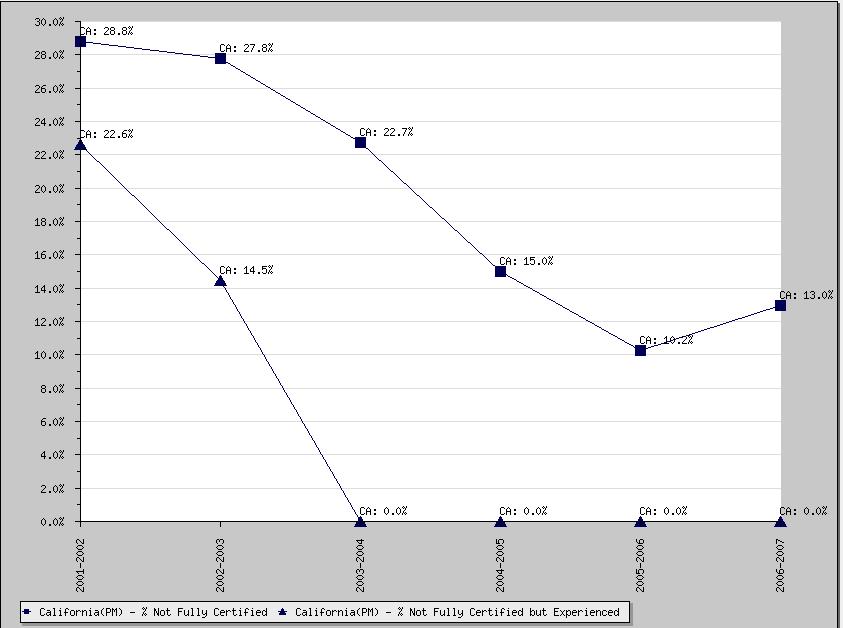
If you go to the map and click on a state, you can get the trend in certification over time. This shows special ed teachers who aren’t fully certified in California:
Of course, there are all sorts of interesting questions about special ed that this data set doesn’t address. The evidence is pretty clear that boys are more likely to be diagnosed as having a learning disability than girls are, and some critics suggest that behavioral issues like acting up and causing teachers headaches are becoming the basis of a diagnosis that can have life-long consequences for teachers’, parents’ and students’ expectations about how they’ll do in school. Insofar as perceptions of behavior are affected by a student’s race (see Ann Ferguson’s Bad Boys: Public Schools in the Making of Black Masculinity), this could have particularly negative consequences for some groups.
Interpreting rates of use of special ed programs is hard, too. Does the fact that Black kids in Iowa have much higher rates of qualifying for special ed courses than Black kids in Mississippi do mean that there are more disabilities in Iowa? Or that kids there benefit from better screening to identify kids who might benefit from the classes?
Aside from that, thoughts on what might be causing the dramatic differences in rates between states and between race/ethnicities?
Comments 62
Anonymous — September 22, 2010
Had to note the colors used on the map: apparently Black kids who are in special ed are "more Black"?
T — September 22, 2010
Looking at the states with the highest percentage of black kids in special ed, these are also the states with the lowest percentage of black kids. Setting questions of racism (and related topics) aside... take Vermont for example. The black population is 1.0% compared to the national average of 12%.
Montana = 0.7%
North Dakota = 1.2%
Wyoming = 1.4%
Wisconsin = 6.2%
A contributing factor may simply be that small subset of special ed kids can skew the statistics given the small population.
Of course, I'm sure it's just one contributing factor and the more obvious things probably have more of an effect.
Cola — September 22, 2010
I have to admit that I have trouble understanding these graphs. Am I right to assume that the color for each state represents the race most likely to be represented in special ed classes there?
I find these discussions intriguing because of my own history with special ed classes.
b — September 22, 2010
Yeah, unfortunately these statistics are nearly impossible to interpret on their own. There are so many possible explanations:
- White kids are under-diagnosed because teachers are more willing to see their transgressions and struggles as within normal range while black kids are quickly labeled as abnormal.
- Black kids are over-diagnosed because of this.
- Race is correlated with SES, and kids who grow up poor are more likely to be malnourished leading to impaired development meaning that more black kids really do have learning disabilities.
- Districts in poorer states are less likely to have enough resources to identify and serve the kids who need it.
And on and on. Of course, the truth is probably that there's a little bit of each of these things contributing, but these stats don't help us tease that apart.
Leah — September 22, 2010
As a side note, while behavioural issues may play a role in the greater proportion of boys being diagnosed with a learning disability, there's more to the story. Because of the genetics of the X and Y chromosomes, boys are more likely to be affected by mental retardation, including Fragile X syndrome (the most common inherited cause of mental retardation) than girls.
Meera — September 22, 2010
I'd be interested in seeing the data on race mapped against data on socioeconomic status. I suspect that the numbers are at least in part due to inadequate nutrition -- pre- and postnatally, as well as on a daily basis in childhood. A hungry or simple-carbohydrate-filled child is not likely to be able to learn very effectively, and these food issues disproportionately affect poor families.
Miriam — September 22, 2010
I know that when my mom had a job as a tutor in the inner city she complained about having to work with students she didn't have the training to help because the school didn't have money for special ed programs->they didn't diagnose the kids who really needed it->my mom had to try to tutor them with an inadequate program. I didn't read the numbers carefully, but it seems like that alone would predict the opposite distribution from what we're seeing. So, I guess I'm not help.
Franz — September 22, 2010
I really never understood why we waste scarce resources on disabilities where the child really has no chance of leading a normal life and ever reaching even average intelligence. We would be better off paying mothers a few thousand dollars to have an abortion when their child is anticipated to suffer from mental retardation than funding the useless chore of attempting to educate their child. That way we could actually use most of the money being poured into babysitting idiots for the identification and betterment of students with the most potential. If such students received the personalized attention that the mostly useless special education students receive we would be infinitely better off.
Megan — September 22, 2010
I recommend everyone read the article "In the Shadow of Brown: Special Education and Overrepresentation of Students of Color" by Ferri and Connor (if you Google it you should be able to find a copy)
The article addresses this issue in depth. One of the points they make is that every the desegregation of schools, one way for white teachers to keep their classes segregated was by recommending black students for special education. Unfortunately, this trend has continued into the present time. Anyway, it's a fabulous read and provides some insight into the overrepresentation of minorities.
neuroradical — September 22, 2010
As an LD person working the the field of disability services, I've run into a lot of discussions about this issue. Unfortunately, these discussions frequently take the form of parents and community members of color denying the existence of their child's disability (and therefore creating obstacles between the individual and potential support), and/or denying the existence of disability in general or the need for special education programs in their schools. At the end of the day, for most intellectual and learning disabilities, diagnostic criteria are not always clearly identifiable and are constantly shifting and it is very easy to misdiagnose. The fact of the matter is that our bodies and brains are far too complex to fit into distinct boxes. The upshot is that it's very easy for us to change the language of diagnosis to fit our frequently destructive cultural needs and desires (one doesn't have to look too far back to find a time when being a person of color WAS blatantly treated as a disability, for example). This flexibility also makes it easier for people to challenge the existence of particular disabilities, because the landscape is always shifting and because misdiagnosis is common. Both of these things are incredibly harmful to neurodivergent and disabled individuals and communities.
When looking at statistics like these though, it's important to not only acknowledge the fact that racism is a contributing factor to the disenfranchisement of youth of color through special ed programs, so are ableism and neurotypicalism. The fact that special education programs can limit a student's access to educational or vocational resources or opportunities and be associated with life long negative consequences is a sign that special ed and it's attendant philosophies are failing their mandate to promote personal growth and integration. Special ed should never be a barrier in an individual's quest to carve out a life for themself, it should function as a tool to overcome barriers. Unfortunately, the stigma surrounding special ed and other services for individuals diagnosed with developmental, intellectual or learning disabilities has become an obstacle in and of itself.
Ultimately though, the discussion shouldn't be focused on who is or isn't disabled, it should center on the question of "what's wrong with being disabled? and how much of that is inherent to disability and how much is socially constructed?"
AWA — September 22, 2010
This is obviously really complicated, but I wonder if one possible explanation lies in different state attitudes to African American Venacular English (AAVE). I'm a sociolinguist and have heard that it is not uncommon for teachers to move speakers of AAVE to special ed. classes as a way to deal with the fact that they don't speak the standard American English of standardized tests, etc. This may be part of the reason why the figures down South are so much lower; Southern English is also markedly non-standard, and not very hugely different from AAVE. Perhaps with a whole class of black and white non-standard speakers, students are put into special ed. classes by actual leraning difficulties, and not native dialects.
Willow — September 23, 2010
Is this the data set for special ed *classes* or special ed *services*? "Special ed" can mean everything from a 100% self-contained classroom to 100% time in a regular classroom, with an aide or with a once-a-week speech or occupational therapy session, and everything in between.
As far as the state to state variations go, it would be interesting to see how the racial data correlate with the typical level of 'mainstreaming.' Are Black kids more likely to receive sped services in places where self-contained classrooms are the norm, and less likely in districts that emphasize mainstreaming?
(I know a lot of people, of all races, who have had to fight really, really hard to get their kids desperately-needed sped services, so I'm not comfortable just saying 'they put kids in sped who don't need it so they don't have to deal with them.' The data absolutely indicate that race/racism is in play, so please don't think I'm denying that, but I don't think it's as straightforward as this explanation).
kristin — September 23, 2010
I'm wondering the same things. There seems to be a lot of people here in the comments who are implying that being in a special ed class = bad. I don't think everyone understands the broad range of services a special ed program provides. I think most are imagining the self-contained classroom with kids who are severely mentally or physically disabled. That's only a small part of sp. ed.
The majority of kids who receive sp. ed. services are getting pull out or push in assistance in one or two subjects in which they are struggling. There are a lot of parents who fight long and difficult battles to get these services for their children. And, in my experience (at several different schools) there is virtually no stigma for the kids receiving them.
Qualification is a complicated process. The fact that a child is struggling isn't enough. They have to have a high enough IQ that the gap between where they are in a certain subject and where their IQ predicts they will be exceeds a certain number. Many parents don't understand the system and don't understand their rights. In my experience, kids are far more likely to get this kind of help if they have intelligent, well-educated, middle/upper class parents. And, it's these kids, along with kids who have speech services, who make up the vast majority of the sp. ed. numbers.
renee — September 23, 2010
I have no data to back this up, but since we're all speculating here, could the higher rates of IDEA Part B services be related to less access to Part C? Part B is special ed for school-aged kids, and Part C is early intervention for kids under 3 with developmental delays. There could be plenty of cases of, say, speech delay, where early intervention with a speech therapist at age 2 prevents the need for ongoing speech therapy in school. Part C is notoriously underfunded and has long waiting lists, so if Black kids were less likely to get early intervention they might be more likely to need services later on.
Kendrick — September 23, 2010
As a special education teacher in New Mexico I found this post very interesting. I agree with several posts already that special education should not be treated as an awful thing students have to deal with. Many of my students are successful in the general education curriculum as long as they have their needs met so that their learning disability does not affect them. These services are not something to be ashamed of.
In addition, it is misleading to look at this strictly as a race issue. As we know, race and socioeconomic status are still unfortunately linked in this country. Students from a lower socioeconomic status are more likely to need special education services for a variety of reasons. They are less likely to be read to as babies and toddlers because of parents working and not having time and this can lead to language delays and disabilities. They are also more likely to be malnourised (as other comments have pointed out) and exposed to lead paint. These factors can delay brain development and in severe cases lead to more serious cognitive impairments.
While it is important to consider race when looking at special education qualification, it is equally as important to consider all factors. To make the jump that students are being qualified simply because of racism is unfounded and it shifts focus from the bigger issues at play.
Sandy Hook, “White-on-White Crime,” and How Privilege Kills | Carte Blanchfield — December 11, 2014
[…] under “zero tolerance” policies. In Connecticut specifically, which ranks in the lowest quintile of states in terms of providing assistance to black children with special needs, no less than 44% […]
frederickgragg — March 31, 2022
The education is necessary because through this you become an expert and get acknowledge about different important aspects. Education software will help children and elders to teach themselves reading, writing and arithmetic skills. https://www.activedumpsnet.com/Salesforce-dumps/Service-Cloud-Consultant.html provides authentic IT Certification exams preparation material guaranteed to make you pass in the first attempt.