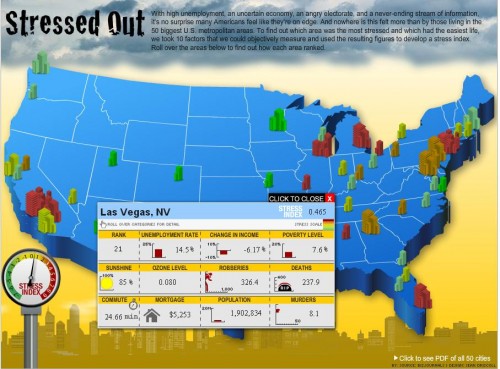
My friend Captain Crab (happy late birthday!) pointed out a graphic at Portfolio that displays the results of their metropolitan “stress test,” in which they use ten measures such as poverty level, unemployment rate, commute, mortgage affordability, etc., to quantify how stressful different metro areas are to live in currently. Obviously it’s a rough measure — they usually use the rates of central cities rather than the larger metro area, people may interpret the same seemingly objective levels of negative or positive factors very differently in terms of how stressed they feel, only the 50 largest metro areas are included, and I don’t know if there’s clear evidence linking less-sunny places to less stress (anyone know?) — but it does provide a snapshot of how different cities compare.
You can hover over a city to get info on its ranking; since I live in Vegas, I checked it out, which has the highest unemployment rate of the 50 metro areas studied, but hey, we get lots of sun!
Just to clarify, the mortgage indicator isn’t the average mortgage, it’s the “affordability” of the mortgage “expressed as median house value per $1,000 of median household income”. The most unaffordable city? New York, followed by L.A.
The overall most stressful city is Detroit; the least is Salt Lake City. If you want to waste more time comparing the rankings on each of the ten measures, they have tables listing the results.


Comments 13
Fritz — September 8, 2010
I live in Detroit and am perpetually stressed. Just sayin'.
Jared — September 8, 2010
I think we can all agree that this proves that Mormanism works.
Robyn — September 9, 2010
There's a plausible link between weather/climate and depression.
http://en.wikipedia.org/wiki/Seasonal_affective_disorder
Day — September 14, 2010
I think it's worth mentioning that they take only murder and robbery into account for crime, but not rape or domestic assault. This occurred to me because Utah has one of the highest rape rates in the developed world.
One almost thinks it would have been more accurate to compare the level of stress related disease and death in various cities.
It would be interesting to do an analysis like this that compares likely stress levels by race or gender; income adjusted for professions that are male or female dominated, etc.
Day — September 16, 2010
Your statistics are almost five years old. My allegation that Utah is close to the top comes from a training I attended last summer to be a rape crisis counselor for this group:
http://www.cwcic.org/
During the training, multiple experts from different organizations mentioned that Utah is second in the nation for rapes per-capita, with Alaska coming in first.