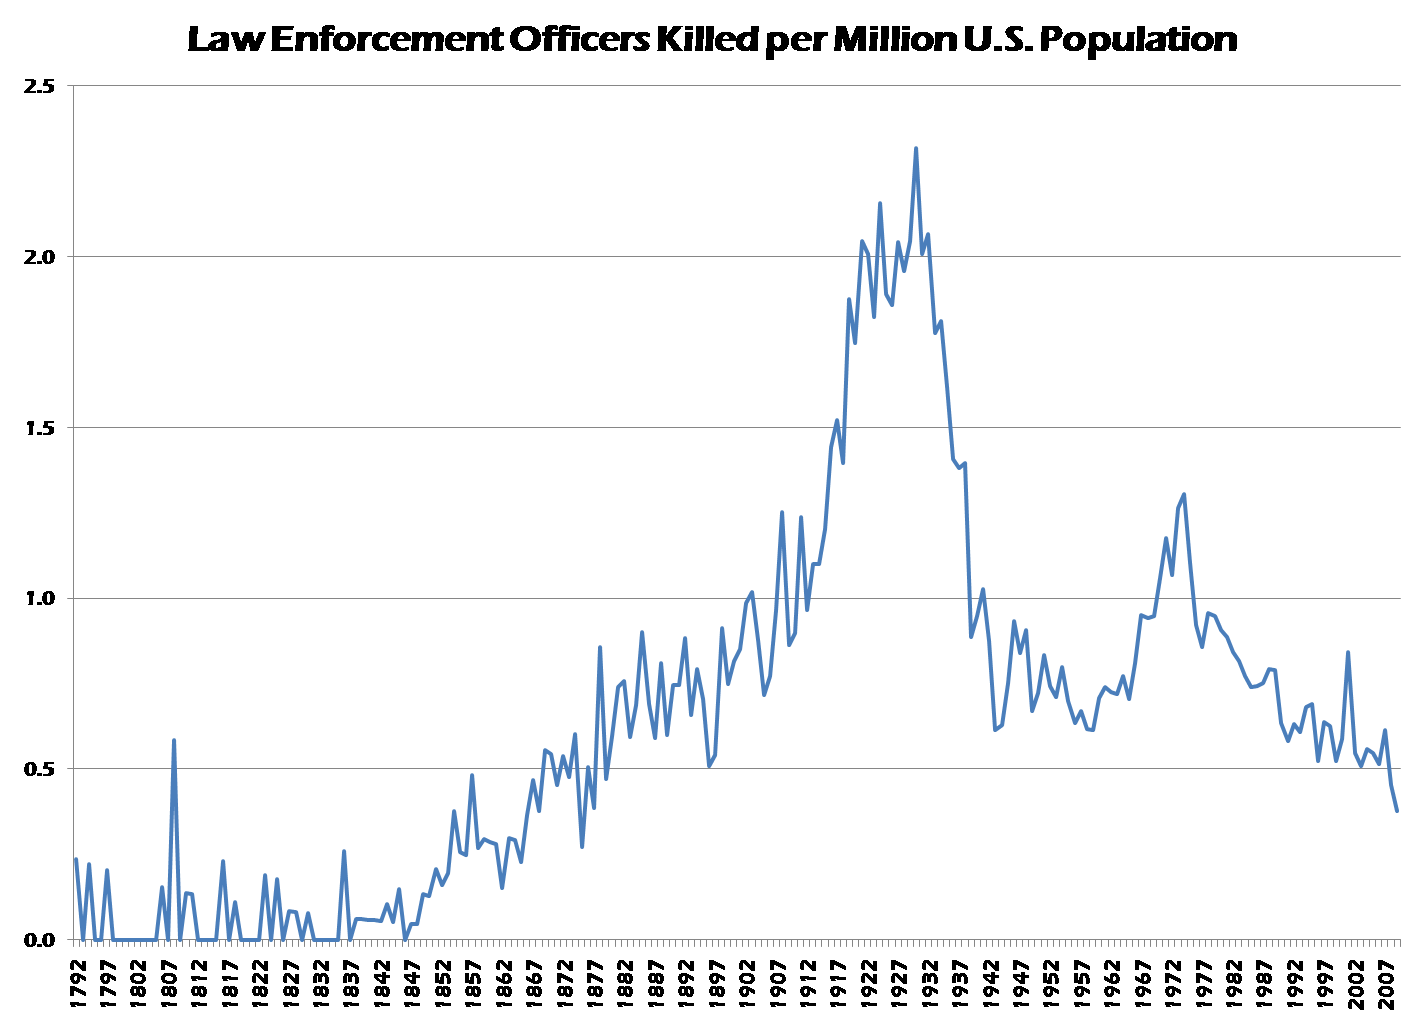
In a few weeks, California voters will consider Proposition 19 — The Regulate, Control and Tax Cannabis Act of 2010. This measure (1) legalizes various marijuana-related activities, (2) allows local governments to regulate these activities, (3) permits local governments to impose and collect marijuana-related fees and taxes, and (4) authorizes various criminal and civil penalties. As the national Gallup data indicate below, support for marijuana legalization has risen dramatically over the past quarter century, to the point where such ballot referenda now have a strong chance of passage in states like California.

I’ve gotten a few calls on the subject and wish I knew more about it. At this point, I defer to my California colleagues because I simply do not feel sufficiently informed or qualified to render an opinion as either an expert or a private citizen on this issue. But I do know this: should Proposition 19 pass, it would likely portend a Very Big Change in past practices and policies with respect to marijuana. Some excellent researchers at the RAND Drug Policy Research Center (Beau Kilmer, Jonathan P. Caulkins, Rosalie Liccardo Pacula, Robert J. MacCoun, Peter H. Reuter) have made heroic efforts to model the likely effects of such a Very Big Change, based on estimates of current and future consumption, likely price changes, taxes levied and evaded, and nonprice effects (such as a change in stigma), but they acknowledge that we are in uncharted waters. Their best guess? 

(1) the pretax retail price of marijuana will substantially decline, likely by more than 80 percent. The price the consumers face will depend heavily on taxes, the structure of the regulatory regime, and how taxes and regulations are enforced;
(2) consumption will increase, but it is unclear how much, because we know neither the shape of the demand curve nor the level of tax evasion (which reduces revenues and prices that consumers face);
(3) tax revenues could be dramatically lower or higher than the $1.4 billion estimate provided by the California Board of Equalization (BOE); for example, uncertainty about the federal response to California legalization can swing estimates in either direction;
(4) previous studies find that the annual costs of enforcing marijuana laws in California range from around $200 million to nearly $1.9 billion; our estimates show that the costs are probably less than $300 million; and
(5) there is considerable uncertainty about the impact of legalizing marijuana in California on public budgets and consumption, with even minor changes in assumptions leading to major differences in outcomes.

So, marijuana will become significantly cheaper in California, but we cannot tell for certain whether the increase in consumption will be correspondingly large (say, to the peak marijuana levels of the late-1970s).  We also can’t say for sure how much will be collected or evaded in taxes, saved or spent on treatment and law enforcement, or how neighboring states and the federal government will respond. The RAND report is helpful in showing both the kinds of factors to be considered before casting one’s ballot and the limits of our current knowledge base.

On balance, will we be better off or worse off in a post-Prop. 19 world? At this point, responsible experts, including  the RAND team, are pointing to an unusually large gap between the change voters must consider and our knowledge about its likely impact.  Call me gutless, but under such conditions my personal preference would be for a gradual phase-in and limited pilot period before attempting to flip such a Very Big Switch in a state of 39 million people.

The FBI has released their Uniform Crime Report Crime in the United States numbers for year-end 2009 and, once again, the rate of crimes reported to police continues to fall.

I’ve just begun to explore the new report, but researchers can easily download spreadsheets to show long- and short-term trends in both population-adjusted rates and raw numbers. The chart above shows the crime decline since 1990 in murder, rape, robbery, aggravated assault, motor vehicle theft, burglary, and larceny-theft. This chart makes it apparent how much the overall crime numbers are driven by larceny-theft — and the comparative rarity of violent crimes such as rape and murder.

But crime is dropping across each of these categories. The purple bars show the magnitude of the drop in the past 20 years, comparing 1990 rates with 2009 rates, or ((2009-1990)/1990). The green bars show the most recent change from 2008 to 2009 ((2009-2008)/2008). I’d normally compare these numbers with those from the National Crime Victimization Survey before drawing any big conclusions about crime trends. With regard to the FBI’s official crime index, however, it seems pretty clear that there has been a significant drop in crime reported to police over the past year and, for that matter, over the past twenty years.

Despite a new wave of programs and research, people still write about reentry using the stylized tropes of old James Cagney and Humphrey Bogart movies. Either the ex-prisoner is portrayed as a noble witness to this cruel world, as a predatory menace to be gunned down, or (in more sophisticated variants) as a gangster with a heart of gold.

Given these cultural reference points, it takes courage to say something real and true about the lived messiness of reentry — especially when one’s freedom or livelihood depends on telling convincing narratives of success. Josh Page tipped me off to a short piece by Jody Lewen of the Prison University Project, who describes the sort of reentry experience I see played out in my research and in everyday life.

In the latest issue of the PUP Newsletter, Dr. Lewin writes about a former client who hadn’t committed any major new crime but had nevertheless violated the conditions of his release.

Derek Meade had been an exceptional student while in the program at San Quentin, had enrolled in school immediately after paroling to continue his studies, and had also managed to find a part-time job. He had sounded great for quite a while. When he didn’t respond to one of our messages, we sent another, and he finally wrote to say that he had recently relapsed, and was close to being sent back to prison as the result of two positive drug tests. He said he hoped to send us the letter soon, with some better news.

Derek’s assumption was, of course, that his current news was “unfit” for the newsletter. It was as if he had absorbed the pressure we often feel to provide nothing but upbeat success stories and clear evidence of our “results.” And yet how many of our former students – or other people in recovery, for that matter – experience the same thing he was going through? What impact does it have on those individuals never to see their experiences reflected in publications about our programs? And equally important: how does this absence affect the public’s understanding of our work – whether in terms of the value of education for people in prison, or the role education can play in the process of recovery?

Of course, there are two layers of courage here. Unlike Mr. Meade, many clients will remain silent about their struggles and only share stories of unadulterated success or extreme hardship that justifies their actions. Unlike Dr. Lewin, many program directors will select and highlight only those narratives that celebrate the transformative power of their programs or justify a claim to greater resources. In challenging such biased and selective pictures, they give us a glimpse of what reentry is really like — and it is rarely as black and white as those old movies.

ps. If you’d like to support the Prison University Project, you can make a donation in any amount.

Here at pubcrim, we’re devoted fans of Criminology & Public Policy, the American Society of Criminology journal devoted to policy discussions of criminology research. So we’re delighted to report that C&PP is publishing the piece we’ve informally designated as our pubcrim manifesto. We can’t imagine a better home for these ideas.

Articles in C&PP are generally accompanied by a set of critical policy essays, written by smart experts in reaction to the article. We’re still correcting our page proofs and have yet to see the policy essays, but we’re looking forward to some tough but fair critique. In lieu of abstracts, C&PP asks authors to spell out the research summary and policy implications on the front page. Here’s ours:

Research Summary
Public scholarship aspires to bring social science home to the individuals, communities, and institutions that are its focus of study. In particular, it seeks to narrow the yawning gap between public perceptions and the best available scientific evidence on issues of public concern. Yet nowhere is the gap between perceptions and evidence greater than in the study of crime. Here, we outline the prospects for a public criminology, conducting and disseminating research on crime, law, and deviance in dialogue with affected communities. We present historical data on the media discussion of criminology and sociology, and we outline the distinctive features of criminology—interdisciplinarity, a subject matter that incites moral panics, and a practitioner base actively engaged in knowledge production—that push the boundaries of public scholarship.

Policy Implications
Discussions of public sociology have drawn a bright line separating policy work from professional, critical, and public scholarship. As the research and policy essays published in Criminology & Public Policy make clear, however, the best criminology often is conducted at the intersection of these domains. A vibrant public criminology will help to bring new voices to policy discussions while addressing common myths and misconceptions about crime.

The Wall Street Journal is reporting on “black flight” from Detroit, or the out-migration of “taxpaying, middle-class professionals who invest in local real estate, work and play downtown, and make their home” in the central city:

By some estimates, this year’s Census will show a population drop of 150,000 people from the 951,000 people who lived within city limits in 2000. That would be roughly double the population loss in the 1990s, when black, middle-class flight began replacing white flight as the prevailing dynamic. There are other signs the middle class is throwing in the towel. From 1999 to 2008, median household income in Detroit dropped nearly 25% to $28,730, after growing 17% in the 1990s, according to Data Driven Detroit, a nonprofit that analyzes Census data for the city. Over that period, the proportion of owner-occupied homes fell to 39% from 49%, while the proportion of vacant homes nearly tripled to 28%.

The Journal identifies serious and persistent crime problems as driving the trend. Motown’s violent crime rate has generally fallen since the 1980s and declined again by about 2% between 2008 and 2009. Nevertheless, Detroit remains a relatively dangerous city, with crime problems likely exacerbated by the residential instability brought on by the housing crisis. Although cross-city comparisons can be misleading (mostly because jurisdictional boundaries and denominators vary so greatly), the violent crime rate was about 75% higher in Detroit than in Minneapolis in 2009. Moreover, Gallup polls consistently show that Detroit is perceived as a dangerous city:


As the graph shows, Americans have long viewed Detroit as a dangerous city, with only 18% viewing Detroit as a safe place to live or visit in 1990. This perception improved as crime declined in the 1990s, but had fallen back sharply by 2006. Perceived safety improved much more rapidly for cities such as New York and Chicago, such that these cities are now viewed as significantly safer than Detroit. I couldn’t find any data beyond 2006, but I suspect these trends in perceived safety have continued.

My sense is that flight from Detroit, both black and white, is driven partly by these perceptions and partly by the lived reality of crime in Detroit neighborhoods. I poked around the Detroit Police Department site tonight, looking for some reassuring long-term trend data. I found few statistics of any kind there, though I did discover the department’s youtube channel. I’m sure the video below was well-intended, but such chilling safety tips will do little to reassure residents or change perceptions about the city’s safety.

The Minnesota law enforcement community turned out strong to honor the memory of Officer Joe Bergeron of Maplewood, killed in the line of duty on May 1. Of course, such deaths ripple outward to affect much broader communities. I recall my mother’s stories about a brave officer in our family — the nice cousin who sang Everly Brothers songs with her, I believe — shot and killed during a basic traffic stop. So I was especially troubled to see media reports citing a “a 17 percent jump in the number of officers ‘feloniously killed’ in the line of duty.”

The reports are based on an FBI press release, but is it really the case that More Officers Died in the Line of Fire in 2009? The National Law Enforcement Officers Memorial Fund tracks law enforcement deaths by year and jurisdiction, while the Officer Down Memorial Page provides breakdowns by state. These include both felonious deaths (which are primarily firearms-related) and accidental deaths (which are primarily traffic-related). The long-term trend in officer deaths is shown in the first figure below. You can see peaks of 285 deaths in 1930, 279 in 1974, and 240 in 2001, but a decline to 116 officer deaths in 2009.

Of course, there were a lot more people in the United States in 2009 than in 1974, and a lot more in 1974 than in 1792. To get a better sense of long-term trends in the rate of law enforcement deaths, I plotted this long NLEOMF data series after standardizing it by population. The figure below shows the resulting rate of law enforcement deaths per million citizens.

Death rates were highest during the prohibition era from 1920-1932, reaching a peak rate of 2.32 officers per million population in 1930. Officer deaths then dropped dramatically in the 1940s and 1950s before rising again to a second peak of about 1.3 deaths per million in 1974. Since then, there has been another steep decline that extends to the present. By my calculations, the 2009 death rate of .38 per million has now reached its lowest point since 1875.

While there were indeed 7 more felonious deaths in 2009 than in 2008, I can find no evidence of a longer-term increase in the rate, number, or proportion of felonious deaths. According to an NLEOMF research bulletin, about 62 percent of officer deaths were felonious in the 1970s, about 54 percent were felonious in the 1980s, and about 46 percent were felonious in the 2000s.

A few caveats on this analysis: I cannot vouch for the quality of the National Law Enforcement Memorial Fund data in the early years of this series, but it seems to track the FBI data very closely for more recent years. One might also critique the latter figure for using the total population as the denominator rather than the number of law enforcement officers.

Finally, it should go without saying that 116 officer deaths remains far too many. Nevertheless, this picture is far more heartening than the one painted by recent news reports — the rate of officer deaths appears to be lower today than it has been for the past 135 years.

Frederick Melo at The Usual Suspects comments on the high rates of advanced degrees among police officers in Minnesota. He cites a bit of the criminological research literature on the effects of higher education, but didn’t mention a new paper in Police Quarterly by Jason Rydberg and William Terrill.

I won’t belabor the methods or Project on Policing Neighborhoods data source, but I graphed the main finding above: relative to less-educated officers, those with college experience are significantly less likely to use force in police-citizen encounters. About 56 percent of interactions with college-educated officers involved force, while about 68 percent of encounters with non-college-educated officers involved force. This relationship holds up (p < .001) in models that adjust for age, experience, suspect characteristics, and the setting of the encounter. In contrast to the use of force, defined here as “acts that threaten or inflect physical harm on citizens,” there appears to be no relationship between education and arrest or search behavior.

Even with a nice set of statistical controls, one could interpret these findings as the result of self-selection processes — that is, there might be something about the type of people who go to college (rather than the college experience itself) that results in less force by officers. Plus, force is difficult to measure and, if I’m interpreting them correctly, these levels look suspiciously high.

Nevertheless, the basic finding has now been replicated across a number of data sets and research settings. Why haven’t we required all officers to hold advanced degrees? The old arguments involve the desirability of recruiting less-educated former military personnel, while the new arguments involve the desirability of recruiting a less-educated but more diverse force. The enduring argument, I suppose, involves costs: if we require all officers to have a college degree, we might have to pay them more.

They’re doing some conversation-provoking social psychology in the Carlson School of Management these days — and I’m not just saying that because Heather and I are speaking there tomorrow. The latest “talker” is Vladas Griskevicius’ Going Green to Be Seen: Status, Reputation, and Conspicuous Conservation, forthcoming in Journal of Personality and Social Psychology. From the abstract:

[W]e examined in three experiments how status motives influenced desire for green products. Activating status motives led people to choose green products over more luxurious non-green products. Supporting the notion that altruism signals one’s willingness and ability to incur costs for others’ benefit, status motives increased desire for green products when shopping in public (but not private), and when green products cost more (but not less) than nongreen products.

So, status motives apparently lead people to forgo luxury for the environment only when such choices can be observed and influence one’s reputation. Hmm. I suppose an unscrupulous operator could profitably apply this research by purchasing replacement hybrid badges — the very icon of conspicuous conservation — and reselling them at a nice markup to the guilt-ridden drivers of gas-guzzling luxury vehicles. Sure ’nuff.

The Kansas City Star reports that a bill passed by the Kansas House would require those convicted of soliciting a prostitute to be listed on the state’s sex offender registry for 10 years.

Prostitution involving adults is typically a misdemeanor, subject to fines and/or a short jail term, though the activity has long drawn shame-based sanctions. For example, police departments in Minneapolis and St. Paul now post photos of people arrested for soliciting prostitutes — a punishment that can be far more frightening than a $700 fine. In many jurisdictions, those soliciting prostitutes must also attend “john school,” where the lessons combine deterrence (e.g., powerpoint slides of late-stage STDs; a stern prosecutor’s lecture) with an appeal to family and community values (and their wives, mothers, and daughters).

While recognizing the social harm involved with prostitution, I’d hate to see further expansion of state registries. If you think it is tough to get a job with a felony conviction on your record, try applying as a sex offender. I’ll never forget a phone call from one such offender in a western state. He had worked steadily throughout his adult life until his conviction, but had been unable to gain any real employment in the nine (crime-free) years his name appeared on the registry. When he learned his ten-year term of registration was changed to a lifetime registration requirement, he broke down completely and resigned himself to social isolation and dependency.

In short, a decade-long registration requirement would represent a significant increase in punishment if the Kansas bill were to become law.

-via sentencing law & policy.

via Sarah W: Artist Paul Rucker uses animated mapping and a powerful original score to depict U.S. prison growth in Proliferation. Each dot corresponds to a new prison — and the punishment, pains, and penance therein. I believe the source data are based on some Geographic Information Systems work by Rose Heyer at the Prison Policy Institute. The result is surely more effective and affecting than social science presentations of the same information.