economics

España Gastos Estados

Espana Gastos Estado
Espana Gastos Estado (2008) | Publico.es

What works

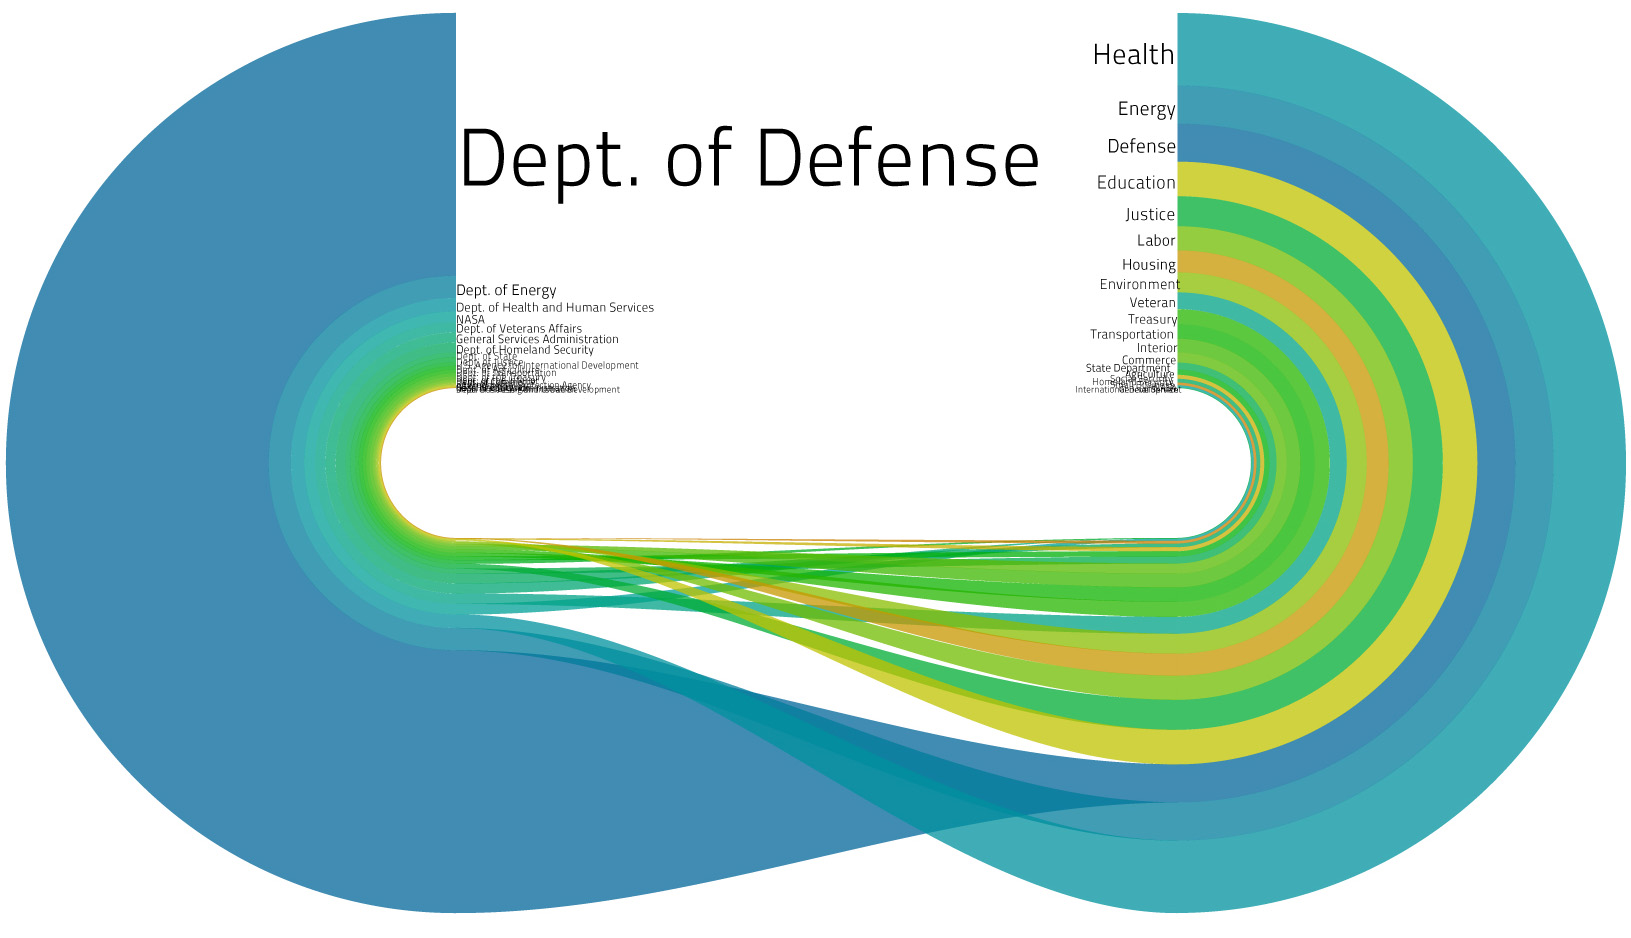
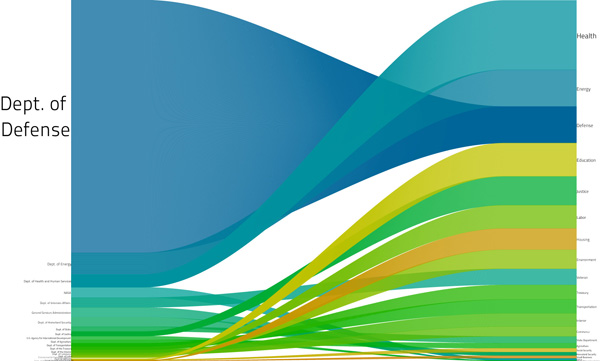
The point of the graphic is to show how funds flow – money in, money out. Now, we have seen this kind of thing before, but here I just want to point out that in cases where the flow of a quantity is the point of the graphic, there are some benefits to abandoning the graph format. Just try to imagine this as a bar graph. It’s easy enough. Instead of flows orienting themselves at right angles and looping arrows, they just straighten, assume the same width, and grow to varying heights. Flows in could be black, flows out could be grey (and overflows could be red!). What would be lost in a bar graph would be the sense of flow. If done cleverly, what would be gained in a bar graph would be the ease of comparing the size of in-flow to the size of out-flow.

Another benefit of this graphic is that it becomes obvious that information graphics can cross international boundaries with greater ease than, say, the same information written out in a report. My Spanish is improving, but I still could not make it through a report on the budget. I can, however, stumble through this information graphic.

What needs work

Here, it is difficult to sense, without doing mental math using the numbers provided, how in-flows compare to out-flows. I’m also a little confused about why some flows fall into the hand, and others terminate outside the hand. I would think education, sanitation, basic public services, housing services, and employment services would be the kinds of things flowing into the public hand. Research and transfers to other administrations, not so much. Pensions, yes, they should go to the hand and they do.

What do you think of the hands? As an aesthetic device, I’m not sure I like them at all. As a device to segregate categories of spending into those that are more directly aiding the public and those that are swirling around in a more internal fashion – research dollars going to schools, institutes, and the military which are primarily funded by the government are pseudo internal – I could support that. I just don’t think it was done correctly here.

References

publico.es (2008) “Espana Gastos Estados” [graphic by Jorge Doneger and Alvaro Valiño]

Second Trimester 2010 Rental Prices in Madrid
Second Trimester 2010 Rental Prices in Madrid | idealista.com

What works

This idea is so simple and demonstrates the reason tables are great as well as the reason trend lines are great. In general, tables are capable of organizing more information than most information graphics. Sure, you can have small 2×2 tables but there can also be tables that go on almost to infinity (or so it seems if you are asked to turn them into an information graphic). But tables are extremely flexible and this is just one simple example of how they can accommodate trend lines.

The folks at idealista.com prepared a report covering second trimester rental prices in Spain and above you can see what has been going on in the neighborhoods of Madrid. They include the numbers as well as trend lines that demonstrate in a glance the recent history of prices in those neighborhoods. It isn’t rocket science to stick those trend lines right in the table, but it is useful. This should also remind all of us that trend lines are legible even when they are very small.

What needs work

Those trend lines need at least a start date and an end date. It is tempting to think that they start at the beginning of the trimester and end of at the end of that trimester but it is unclear (and unlikely, in my opinion). Plus, some of the trend lines seem to start up in the middle rather than at the beginning.

Rental prices in Spain – 2010

In case you came to this blog because you are, in fact, concerned about housing rental prices in Spain, here’s a summary of the report. While there have been statistically significant but small price changes in some markets, in Madrid and Barcelona, rents are basically holding steady.

References

idealista.com (2010 16 July) Evolución del precio de la vivienda en alquiler [Rental housing price report]

Manhattan traffic patterns
Manhattan traffic patterns | Wired Magazine June 2010

What works

The tendency with geographical data is to try to find a way to portray everything on a map. Surely, there is a map up there, and many people will recognize that the area is Manhattan instantly by looking at the map before they read it in the title. That’s a nice thing about maps – they transcend language and bad captioning to some degree. However, much of the detail is not to be found in the map. The map just shows us where congestion tends to occur, but it doesn’t tell us when we can expect these areas to be congested or just what “congested” means. In Manhattan, the average speed is under 10 mph so does congested mean less than 5 mph? Or what?

But if we look at the other graphs and charts it is a veritable jackpot of traffic information, at least at the collective level. I wouldn’t try to use this collection of information to plan your route through the city unless, of course, this collection of information causes you to take the subway instead of driving.

I hate pie graphs (as in the “Proportion of Miles Traveled”), but I am sympathetic to the triangulated pie graphs in the “Vehicle Distribution” graphic. At least it is visually easier to calculate the volume of a true triangle than a rounded off triangle. So if you find that you have to go with a pie graph, emulate the triangulated version found here and your viewers will come away with a better understanding of the information you are attempting to convey. I was surprised at how many people take taxis to get to work. But I am even more surprised at how many fewer trips there are on weekends. Fewer than half of those made on an average weekday.

Anecdotal evidence warning: When I first moved to Manhattan, I remember sitting in the car for two hours to drive around the block. There was a street fair nearby (not on any of the sides of the block traversed in this trip) and that seemed to slow everything to a standstill.

What needs work

I would have found a way to combine the average speed and the delays and associated costs. Clearly, the two are related – lower average speed must mean more delays. I had a little trouble understanding the delays and associated costs without the text from the article. If the speed and costs had been integrated into a single graphic instead of split into two (with a big pie graph in between), I think the link between speed, delays, and costs would have started to become more intuitive.

Here’s an excerpt from that section for the curious:

“In the end, Komanoff found that every car entering the CBD causes an average of 3.23 person-hours of delays. Multiply that by $39.53–a weighted average of vehicles’ time value within and outside the CBD–and it turns out that the average weekday vehicle journey costs other New Yorkers $128 in lost time.”

For more on how that was calculated, you’ll have to read the article. But the bottom line came down to a proposed $16 toll to enter Manhattan below 60th Street. It’s about what drivers in central London pay and the proceeds would go to bolster public transportation. Such an idea – known as congestion pricing – was proposed by the Bloomberg administration but voted down in 2008.

References

Salmon, Felix. (June 2010) “The Traffic Cop.” in Wired Magazine [infographic by Pitch Interactive].

Bonanos, Christopher. (17 December 2007) “Fare Enough” New York Magazine.

European football revenues, 2008-08 | The Economist

What works

This is not my favorite graph (donuts, pie charts, any graph named after a pastry seems doomed to be difficult to digest). Having trouble finding much to like, except that it is about the economics of a current event, which adds a data-driven contextual angle to a cultural event. That part I like.

What needs work

The text accompanying this graph points out that, “Most of the money coming in from television, tickets and so forth goes out in wages. Deloitte says that only two of the big five, Germany’s Bundesliga and the English Premier League, operate at a profit.” However, the graph doesn’t give any indication of profit, only of revenue. It also doesn’t explain where the revenue comes from and goes to, which leaves this infographic horribly flat.

Further, reading these donut things, the next generation of the hated pie graphs, is visually difficult. Bar graphs would have been better. At least they included the numbers so we can forget looking at the graphic and just compare the numbers.

References

The Economist. (10 June 2010) “Football”.

Shipping by Barge
Shipping by Barge | Lock and Dam #1, Mississippi River at St. Paul/Minneapolis

What works

Amidst all that discussion of environmental sustainability and local food movements, I haven’t heard anyone even whisper a mention of barge shipping. Waterways used to be some of the best shipping lanes (sometimes some of the only shipping lanes) available. Now there isn’t much traffic of that sort at all. This graphic implies that it might be in the best interest of economical and environmental efficiency to reconsider barge shipping. It certainly got my cognitive wheels whirring.

Style points for the reduced color pallet. In my book, lots of things could be black, white, and red* all over.

*where red can be switched out for just about any color at all

What needs work

First, I apologize for the quality of the photograph. Cell phone cameras, big posters, and narrow walkways make for crappy pictures. At least it was a cloudy day and there wasn’t so much glare.

This graphic was clearly created a long time ago – I’m guessing it has been hanging in the same place for a couple decades. Still one would think that since the 1970’s, at least some people in the US have cared about fuel efficiency. This graphic only displays an odd kind of size efficiency which is incredibly difficult to understand the more you think about it. Sometimes size matters. In this case, size as measured by number of hauling units (which themselves are different sizes) is nearly irrelevant.
In my opinion, it would be better to describe efficiencies in terms of the amount of fuel required for their example trip of a bunch of wheat. Measuring fuel burned would not only allow us to be able to compare between the modes, it would also allow us to understand the cost per pound of wheat (or whatever) in terms of transport alone, which could be of interest to all the local food folks. Does living on the Mississippi make all upstream food “local” in a way that overland food isn’t, at least if it is shipped by barges?

The next step after adding some kind of measure of fuel efficiency would be to spell out the kinds of emissions that are involved with each mode of transit per pound of item delivered.

I’m also curious about what kinds of commodities can be shipped efficiently by barge – is it only commodity level items like grains, coal, corn, taconite? Or would it make financial and environmental sense to load barges up with products like cars and consumer goods? And what happens to the materials when they come off the barge? Are they mostly shipped to areas where the manufacturing takes place near the river port? Minneapolis used to be a city in which grain mills lined the banks of the Mississippi and a barge full of flour could just be brought directly from the barge into the flour mill, no trucks or trains got involved. But what about other products? Not all cities are located on navigable rivers so once goods come off the barges are they usually placed on trains, on trucks, or what?

In short, this graphic implies that barges are more efficient or more economical than train or truck shipping modes but it fails to provide enough context to support that claim or to indicate which kinds of shippable goods are best for barge shipping.

References

Photograph by Laura Norén, June 2010. Feel free to borrow it, morph it, post it elsewhere, etc.

US Federal Contract Spending | Pitch Interactive for Design for America Contest
Another Iteration | Pitch Interactive for Design for America contest
US Federal Contract Spending, the straight story | Pitch Interactive for Design for America contest

What works

What I especially like about the full blog post describing the development of this graphic is that it presents multiple iterations of the same design as the designers respond to difficulties they uncovered along the way as well as criticisms from the blogging world.

The third one, that loses the circle concept, works best for me. The labels are legible and I understand how contract spending and the media coverage (they used the New York Times, so that’s how you should interpret the term ‘media coverage’ here) of contract spending are related more clearly than in the circular version where the implication that the flow is not a simple one-way deal gets lost. And confuses things.

What needs work

Honestly, there have been plenty of criticisms of this graphic already. Rather than repeat what others have said, I’m going to introduce you to Matthias Shapiro at Political Math (a stranger to me) who has provided an intelligent critique of the above visualization series. He says,

Pitch Interactive has gotten beaten up a great deal over this visualization and they have been nothing but gracious throughout. So I just want to take a moment to say that I think their work is remarkable and that the problems with this graph are a series of very honest mistakes.

But one of the things my blog does is point out mistakes to increase understanding.

My biggest problem with the image is that it still perpetuates the stereotype that the federal government spends most of its money on defense. This image in particular drives that point home by ranking the spending areas according to their “media coverage” ranking where we can see the extent of media coverage each department saw (based on the New York Times API). “Defense” reporting is clearly out of proportion to Defense spending.

The first problem has been addressed elsewhere… it’s the issue of scaling the radius instead of the area of the circles. If the numbers were a correct representation of federal spending (more on that later), the circle visualization commits this “radius is not equal to area” visual error that really bugs me. I even gave it a couple pages in my book chapter (now available online for the low, low price of free) and mentioned it in my Microsoft talk on visualization because it is such a common mistake.

But I encourage you to click through and read his entire post. And read the entire post that Pitch Interactive wrote, too. I figure with all that reading you won’t care to slog through my opinion.

The general question, I would say, is whether or not this kind of graphic works for displaying relational data – Pitch Interactive is trying to show how fiscal data measured in dollars relates to media coverage measured in mentions in a particular newspaper. What do you think? Does it work for them? Is it a relationship we should care about? And is this kind of depiction something that will work for relating other sets of data that use different measurement scales?

References

Pitch Interactive original blog about the graphics, updated. (1 June 2010) US Federal Contract Spending in 2009 vs. Agency Related Media Coverage.

Shapiro, Matthias. (28 May 2010) Government Spending Visualization Misses the Mark at Political Math: Political Information Visualization and other Math-y Things.

Sunlight Labs Design for America contest.

Selling Out:  How do musicians earn money online? | Information is Beautiful via Flowing Data
Selling Out: How do musicians earn money online? | Information is Beautiful via Flowing Data

What works

Here’s another graphic from David McCandless atInformation is Beautiful (though I came across it when Nathan Yau wrote it up at Flowing Data) which was originally motivated by McCandless reading a piece written by independent recording artist Faza at The Cynical Musician. After the infographic hit the blogosphere, Faza ended up receiving some sort of secondhand criticism which he then countered by trying to explain what he was up to in a follow-up blog (see below for all the blogs in question).

Here’s how he described what he was originally trying to figure out:

“Most of what I write (apart from broader policy or economic issues) is aimed at the independent artist. I’m one myself, so I know the pain all too well. I know that deep down the independent artist hopes for the day when they are making enough money to be able to concentrate solely on their art.

The independent artist does not have a huge fanbase – the evolution of the Internet thus far has not changed this. The independent artist has few resources and usually cannot afford a huge marketing push. The independent artist’s financial situation largely depends on getting the most from her limited fanbase with the least expenditure possible. The biggest bang for the buck, if you will.”

This was in response to folks who pointed out that the future of the music is the past (ie live performance) or that the the profitability of music is not just in the ticket sales but the merchandise! Rightio. But Faza pointed out that for truly independent folks who do not have the resources to get out there and market themselves, going on tour and selling a bunch of tickets (and merch) probably isn’t going to happen. And, selling band t-shirts online is tougher than selling them at concerts, so the interwebs aren’t exactly making a huge difference there either.

10.000 ft view
10.000 ft view

One more thing before we get to the graphic itself. When I was fiddling with it in photoshop I realized that I had a greater appreciation of it when I started with the 10,000 foot view and then slowly zoomed in.

The colors are good. For some reason, black + some bright color is a good idea when it comes to contemporary cultural products like music and fashion. Smacks of a certain dynamism and ‘cool’ factor, which is just the spot this graphic is aiming to hit. Of course, the black + bright color = cultural cool formula will change and it doesn’t mean there are not many other components that could add up to cultural cool. Just saying, I think the basic strategy with the full bleed black background and a single bright color (100% M) is working here. The growing circles also do a good job of making the point that streaming music will not pay the bills and neither will selling downloads on napster or other similar sorts of sites.

The most surprising fact for me was that self-pressing a CD and selling it directly to consumers was more rapidly profitable than any of these other options. New respect for all the folks in New York and LA who have stopped me and tried to get me to buy their music while I’m walking down the street/beach.

What needs work

My biggest issue with this graphic is the the little pie charts are really where it’s at – they are not part of the big picture story that the more ‘advanced’ online music sales techniques are the less profitable per unit of effort they are for the artists. The little pie charts try to show us how the money is allotted. But the revenue pie is never a full pie and it’s difficult to tell where the money that doesn’t go to the artists or labels is going. Some clearly goes into things like the cost of the physical CD (where there is a physical CD) and some goes to the other players involved, right? But how much? And who are these other players? And why choose a pie graph technique if the pie is never completed and the incomplete part is not fully specified? In the end, what those pie charts do is compare revenue streams to two recipients – labels and artists – while offering a general sense of the amount of money going elsewhere (though we don’t know where that elsewhere is). Maybe a flowchart of dollars moving from consumers into different pots would have done a better job of demonstrating that portion of the story.

I would also point out, from a sociological perspective now, that minimum wage is both a logical reference point and a difficult reference point. Minimum wage puts a single person just over the poverty line but the poverty line is incredibly low. Poverty lines are tied to the cost of food rather than to some composite cost of daily living that includes not only food but rent, transportation/energy, health care, and all of those things that people have to spend money on which have increased more rapidly than the cost of food. It’s my long-winded way of saying that even if artists could make minimum wage they would not actually be able to live comfortably, especially not in cities like LA and NYC where there are large, vibrant music scenes. They would have an easier time in Nashville.

References

Faza. (10 January 2010) “The paradise that should have been” at The Cynical Musician.

Faza. (15 April 2010) The paradise that should have been – revisited at The Cynical Musician.

McCandless, David. (13 April 2010) How much do music artists learn online at Information is Beautiful.

Yau, Nathan. (4 June 2010) “How little musicians earn online” at Flowing Data.

EU unemployment rates Nov. 2007 through April 2009

What works

I was looking around for a nice EU-contextualized graph showing Spain’s unemployment rate. I found what you see above which shows unemployment rates in other EU countries. That was one of my requirements – in the EU economics are sort of local and then again not so local so it’s silly to try to look at one country without taking into account the others nearby. What we see, and what has continued since this graphs last data point in 2008 is that Spain has a notably high unemployment rate. News earlier this week put the current unemployment rate here (yes, I’m in Spain) at 19.7%.

Personal anecdotes with no scientific validity whatsoever

When I’m out on the street, I would say this appears to be true – everyday is like a holiday! Well, not really. There are no parades or obvious drunkenness. But there are all sorts of young, able-bodied folks walking around, having a caña, getting on with life. People’s demeanors and attitudes do not, on their surface, suggest depression, destitution, or downtroddenness. Furthermore, I had the brazenness to open my American mouth and ask a Spaniard man I barely know what he thinks of Spain’s economic situation. He said that the unemployment rate is not at all reflective of the actual unemployment rate because everyone is working under the table. That sort of reality, if it is true, would not be reflected in graphs like the ones above and below. If people are working under the table, I can’t imagine they have full time positions just judging by how many young capable-looking people are on the street on weekdays.

What needs work

I don’t know about you, but I don’t like the gradient on the graphs. Seems superfluous. I would have lost the grey background and just gone with some rather straightforward area blocks (no lines between each bar in the graph). In simplifying that portion of the visual, I think there would have been space for more contextual data. I’m no economist, so I looked around to see what economists think of as smart ways to contextualize unemployment rates.

I found this (which has a Spanish focus):

Spain |  Unemployment rate, GDP, and household savings rate
Spain | Unemployment rate, GDP, and household savings rate

What works

The story here is that – oh yes – we can see that unemployment rate bouncing right up. But we also see that Spaniards are saving more. This has been attributed to the expectation by Spaniards that they are going to be taking in their out-of-work sons, daughters, and assorted other relatives during this crisis. We would be shocked to have such a high savings rate in America.

What needs work

I am still trying to figure out what is going on in Spain. At least as I perceive the general attitude, Spaniards appear to be prepared to weather this little ripple in the amazing growth of their prosperity over the last 60+ years by either working under the table (maybe) or leaning on family. Is an 18% savings rate meaningful in the context of a nearly 20% unemployment rate? Will this crisis simply introduce more inequality – those with stable jobs will go unscathed while those without steady unemployment sink lower than family are able to stoop to help them out? And if my man on the street is any kind of correct and the unmeasured economy is booming, how do we measure it?

If you happen to have some expertise on any of these questions, please post to the comments.

US Federal Budget | Jorge Cham at PhD Comics

What Works

This was published as a joke. To be sure, the numbers represent real data. The punch line was supposed to be that research gets so little of the total pool. Or at least that is what I thought it was supposed to be. PhD Comics people prove their dedication to comedy with this. Time consuming to pull together and unlike their normal style.

That being said, others have attempted to find a way to visualize where tax dollars go. The vertical orientation is nice for the web. We’ve all learned to accept scrolling up/down much more than right/left. It’s nice to see tiny slices included here and there.

What Needs Work

I have trouble getting the overview from this graphic. Even just using a bigger font for some of the lumped categories would have helped. The aggregating triangles in the background are good in theory but not quite perfected in practice. Still not totally sure how they are meant to be interpreted.

Reference

Cham, Jorge. (2010) The US Federal Budget.

Europe's Web of Debt | Bill Marsh, The New York Times

What Works

Headlines have lately focused on particular countries – Greece, Spain, Portugal – to discuss the current economic situation in Europe. I like this diagram because it is impossible to think of the EU situation from that one-country-at-a-time perspective. One currency, one tangled web of relationships. We also see that focusing on Greece could be considered short-sighted simply because Greece’s total debt is relatively small compared to, say, Italy which is a country we haven’t been hearing much about. Now, going back to my initial reason for liking this graphic, it’s important not to focus on one country. The adoption of the Euro was motivated by the robustness of networked flows and we see from the graphic that the problems of any one country should not bring it down but, if the cause of the single country’s problems are also putting downward pressure on other countries/nodes in the network, the cascade could be swift and deep. And the biggest losers are going to be France and Germany. Just look at all those arrows directing debt at those two countries. I am not an economist so I’m not making a prediction about the future of the EU economies or of the Euro as a stabilizing device.

What needs work

Because so much of the debt flows involve France and Germany, I think they belong in this diagrams as nodes. Or at the very least, one easy fix would be to show outgoing arrows to Germany all in the same color and to France all in a different color (like, say, the color of freedom).

Reference

Marsh, Bill. (2 May 2010) Europe’s Web of Debt. The New York Times, Week in Review Section from the intial source “Bank for International Settlements”.