
Global charitable giving
How much do people give?
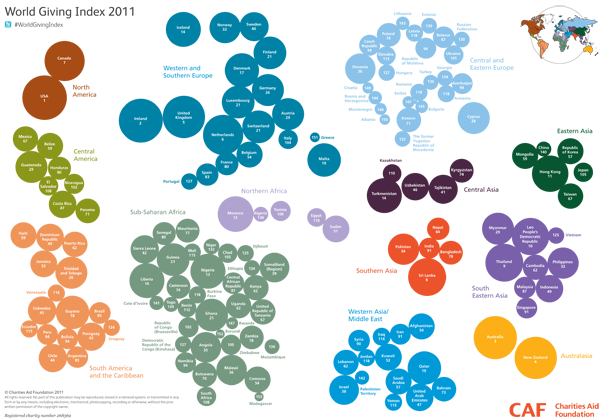
Globally, there are some major differences in giving rates on a national basis. The Charitable Aid Foundation conducts and annual global poll that asks about giving money, giving time, and helping individual strangers. The 2011 report notes that when it comes to predicting which countries have the most generous citizens:
The countries whose populations are the most likely to give are not necessarily the world’s most affluent. Only five of the countries that feature in the World Bank’s top 20 by GDP (PPP) per capita feature in CAF’s World Giving Index top 20.
The US moved from 5th place in 2010 to 1st place in 2011 with increases in the number of people donating time, money, and aid to individual strangers. I guess we respond to the economic crisis by donating to specific people and causes while demanding lower taxes? Anyone else want to try to interpret that?
As for the graphic, I wish there were a key. I figured out eventually that the number inside the circle represents the country’s overall rank and that the size of the circle is proportional to per capita giving. I had to look at the graphic for a while to convince myself that the size of the circles was proportional to per capita rather than total giving per country. The one thing I like most is the inclusion of the small inset map in the upper right corner that helps relate the circles back to the map of the world that we are used to seeing.
But let’s take a look at giving in the US, since we are supposedly the top of the heap as of 2011.
US charitable giving
How much do Americans give?
Caveat: I was not able to find US data from 2011 so the bottom half of this blog and the top half are out of sync temporally. Also, the US study only looked at cash donations whereas the global index looks at donations of cash and time as well as helping behavior towards individual strangers.
Individual giving in America is divided between two general categories of giving – religious and secular. Many church members give cash and write checks to their churches either as part of tithing or in less formal donations to the offering plate when they get around to attending a service. Measures of religiosity in the US indicate that Americans are slowly becoming less religious over time. A WIN-Gallop poll of global religiosity came out on July 27th and showed that only 60% of Americans are regular churchgoers, down from 73% seven years ago. I wondered how that would impact charitable giving here in the US. Unfortunately, the only free data I could find was from 2000 which is well before the findings from the recent poll data. [Note: If you are extremely interested in charitable giving in the US there are quite a few reports available to those willing to pony up some cash at Giving USA.]
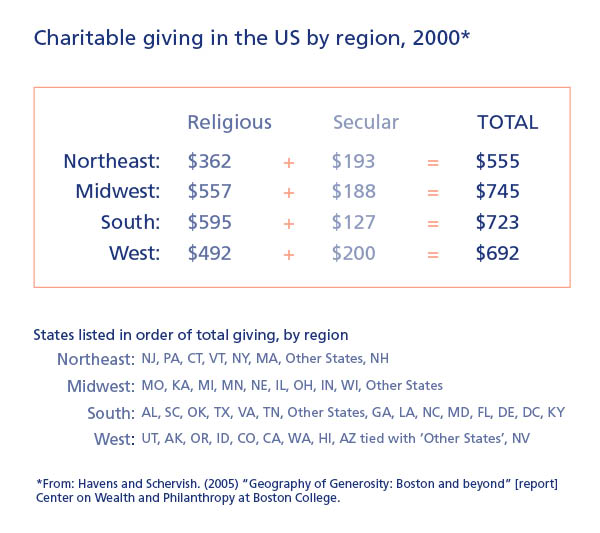
The table above is a summary of the state-level, individual cash donation activity of Americans in 2000 that was originally constructed by John Havens and Paul Schervish at Boston College’s Center on Wealth and Philanthropy. They used a slightly different methodology from the one used by the aforementioned Giving USA group that I found more compelling. Giving USA was looking at cash giving by examining the itemized deductions folks list on their annual income tax forms. However, many people (especially lower income people) do not itemize their deductions. Further complicating matters at the state level is the fact that some states have many more itemizers than others. Therefore, looking at itemizers in one state is very different than looking at itemizers in another state. In one state we might only capture fairly wealthy people. In other state, we might be looking at a much broader cross section of the population. Havens and Schervish not only tried to make sure they had comparable samples of people from each state, they also took into account costs of living in different states and weighted their totals based on the number of households in each state.
I summarized their major findings above. What frustrated my data visualization self the most was that I could not make a similar cartograph that would allow us to see the US the way we can see the globe in the cartograph at the top. Havens and Schervish pooled data for a number of states together – see where I have tried to list all the states in each of the regions? See how it says ‘Other States’ four different times? The explanation for this was that the sample size in some states was so small it had to be pooled in order to maintain the subjects’ anonymity. Fair enough. I just wish it were otherwise.
Are states within the same region similar when it comes to charitable giving? For the most part, no.
The midwest has no major outliers, high or low (at least, not that I can tell given that some states are lumped into that obscure “other states” category). The other three regions show wider dispersion. The west, for example, has the most generous state (Utah: $2632) but just next door is Nevada with a very low rate of giving (Nevada: $303). The south looks fairly generous on average, but that average obscures some dramatic differences. Two states pull up the average (Alabama: $1842 and South Carolina: $1243) and make up for the two of the least generous states which are also in the South (Kentucky: $218 and the District of Columbia: $273). With respect to DC, my hunch is that wealthy lawmakers and other multi-state residents buzzing around DC may be reporting all of their charitable giving on their tax forms for their “home” states. I cannot explain why Kentucky gives so little. Another notable miser of a state is New Hampshire (New Hampshire: $246). Shall we take a moment to ponder the implications of the “live free or die” ideology?
References
Charities Aid Foundation. (2011) World Giving Index [information graphic] Kent, UK.
Charities Aid Foundation. (2011) World Giving Index 2011. [Report]. Kent, UK.
Havens, John and Schervish, Paul. (2005, November) Geography and Generosity: Boston and Beyond [report] Boston: Center on Wealth and Philanthropy at Boston College. For convenience, I extracted the relevant table for download <a href="generosity-report-extract“>here.