American Generation Age Timeline (Age measured in 2009) | Pew Research

What works

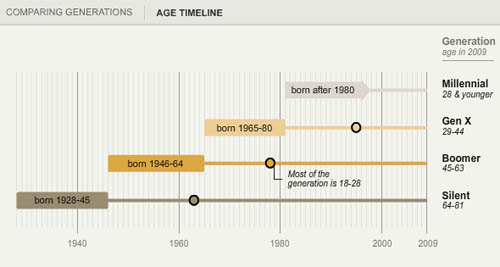
Pew Research has created a tidy series of interactive graphics to describe the demographic characteristics of American generational cohorts from the the Silent Generation (born 1928 – 1945) through the Boomers (born 1946 – 1964), Generation X (1965 – 1980) [this is a disputed age range – a more recent report from Pew suggests that Gen Xers were born from 1965-1976), and the Millennial Generation (born 1981+ [now defined as being born between 1977 and 1992]). The interactive graphics frame the data well. They offer the timeline above as contextual background and a graphic way to offer an impressionistic framework for understanding generational change.

Then users can flip back and forth between comparing each generation to another along a range of variables – labor force participation, education, household income, marital status – while they were in the 18-29 year old age group OR by looking at where each generation is now. The ability to interact makes the presentation extremely illustrative and pedagogically meaningful. It is much easier to understand patterns that are changing over time versus patterns that are life course specific.

Marital status

Marital status by generation measured when young | Pew Research
Marital status by generation measured in 2009 (snapshot) | Pew Research

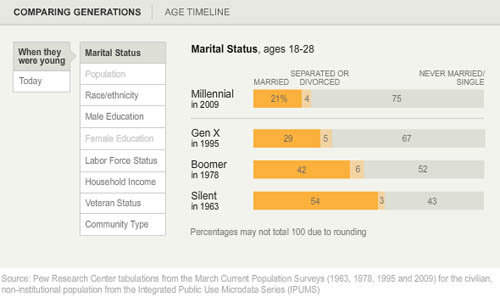
For instance, marital trends have been hard to talk about because the age at first marriage moves up over time, so it’s hard to figure out at what age we can expect that people will have gotten married if they are ever going to do so (I tried looking at marriage here).

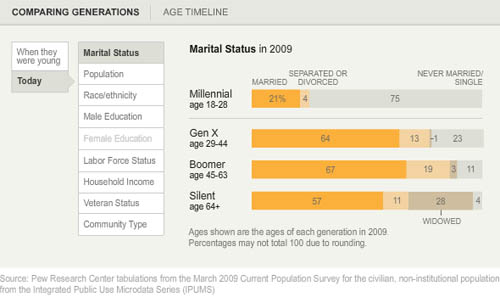
What I like about the Pew Research graphics is that they show us not only what the generations looked like when they were between 18 and 29 years old (above) but also what they look like now (below). Not only does it become obvious how many millennials are choosing to remain unmarried (either until they are quite a bit older or forever – hard to say because the oldest millennials are still in their 30s), but it also becomes clear that in addition to divorce, widowhood is a major contributor to the end of marriage. Keep that in mind: somewhere around half of all marriages end in divorce so that means the other half ends in death. I would guess that a vanishingly small number of couples die simultaneously which means there are quite a few single older folks who did not choose to be single (of course, even if they didn’t choose to outlive their spouses, they may prefer widowhood to other alternatives, especially if their spouse had a long illness).

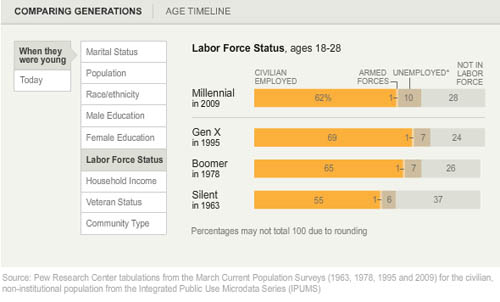
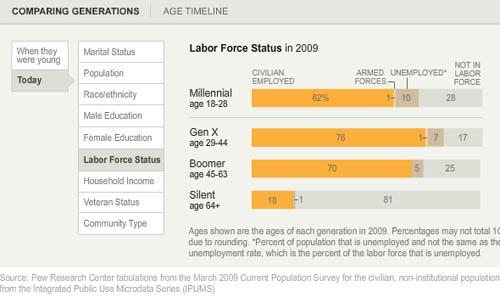
Labor force participation

Here’s another set of “when they were young” vs. “where they are now” comparisons, this time on labor force participation. It appears that the recession has walloped the youngest, least experienced workers the hardest. They have the highest unemployment rate AND the highest rate of educational attainment (and school loan debt), which leaves them much worse off as they start out than their parents were in the Boomer Generation. Even if their parents were in Generation X, they were still better off than today’s 20-something Millennials.

American labor force participation by generation (2009) | Pew Research
American Labor Force Participation by Generation (measured in 2009) | Pew Research

What needs work – Are generations meaningful?

My first minor complaint is that the graphic does not make clear *exactly* what “when they were young” means. If we look at the first graphic in the series, the timeline, it appears that “when they were young” was measured when each generation was between 18 and 29 years old. I hope that is the case. I might have had an asterisk somewhere explaining that “when they were young = when they were 18-29 years old”.

The concept of generations, in my opinion, is a head-scratcher. The idea that I had to come update this blog because the definition Pew was using to define Millennials and GenXers changed (without explanation that I could find) adds to my initial skepticism about the analytical purchase of generational categories. What is the analytical purchase of looking at generations – strictly birth-year delimited groups that supposedly share a greater internal coherence than other affinal or ascribed statuses we might imagine? If we believe that social, technological, and most all kinds of change happen over time, of course there are going to be measurable differences between one generation and the next. I imagine, though I have never seen the comparison, that if social scientists split people into 10- or 20-year pools based on their birth years they would end up with the same sorts of results. So why not think of generations as even units? And is it clear that the meaningful changes are happening in 20-year cycles? Or would 10-year age cohorts also work?

The real trickiness comes in when we think about individuals. Say someone is like myself, born in a year on the border between one generation and the next. Am I going to be just as much like a person born firmly in the middle of my cohort as a person on the far end of it? Or will people like me have about as much in common with the people about 8 years above and below us, but less in common with the people 15 years older than us who are considered to be in the same generation, and thus to have many similar tendencies/life chances/characteristics?

A better way to measure the cohort effect would seem to be to consider each individual’s age distance from each other individual in the sample – the closer we are in age, the more similar we could be expected to be with respect to things like labor force participation and educational attainment. Large structural realities like recessions are going to hit us all when we have roughly similar amounts of work force experience, impacting us similarly (though someone 10 years older and still officially in the same generation will probably fare much better). Since it is computationally possible to run models that can take the actual age distances of individuals in the same into account, I don’t understand the analytical purchase of the concept of generations.

The take-away: great graphics, bad premise.

References

Taylor, Paul and Keeter, Scott, eds. (24 February 2011) The Millenials. Confident. Connected. Open to Change. [Full Report] [See also: Executive Summary and Interactive Infographic] Washington, DC: Pew Research Center.

Food Blog Study Descriptive Statistics Part 1 - Blogger Demographics

What works

Over the summer I surveyed 280 English-speaking food bloggers who were randomly drawn from a network of 23,000. Only the bloggers with email addresses, contact forms, or twitter accounts were invited to participate (obvious reasons…if I couldn’t get in touch with them, I couldn’t invite them to participate).

The graphic above represents my first attempt to present some of the basic descriptive statistics – gender, age, marital status, educational attainment, number of kids – just to see what works visually. Normally, this kind of information is presented in tables (I have those, too), but I wanted to try to add some horizontal bar graphs for impact. I kept them horizontal so that the axes labels would be easier to read.

The percentages are listed; the frequencies are represented visually.

Just for comparison sake (which is kind of difficult): the average age of people in the US is 37.2 (it’s 38.5 for females); about 50.5% of Americans are married now and only 2.5% are cohabiting. As for education, 28.5% didn’t get another degree after H.S., 17.7% stopped after their bachelor’s degree, and 10.4% have professional degrees. Clearly, the food bloggers are well-educated and more likely to be cohabiting than the American averages. I added these comparisons in response to Rob’s request. I know it would have been better to add them to the graphic, but the comparisons are a little tricky because the Census data is looking at a wider age range and I haven’t found any good summary stats on bloggers in general (which would be better than the aggregate comparison to the whole national pool).

What needs work

This strategy would not work for the entire set of variables – boring after a while. I am trying to think of better ways to show more variables at once without just building a column that goes on and on forever.

For more on “what needs work” see the comments section.

Food Price Mashup | Mark Bittman

What works

After looking at this graphic, I imagine most viewers come away thinking that fast food is more expensive than cooking at home, which was the intention of the accompanying opinion piece by Mark Bittman. The graphic succeeds in conveying visually just exactly the point that the article made using words.

The photographs are vibrant and catchy, bordering on food porn.

The sidebars feature the calorie counts for these meals in addition to the large price tags. The nutritional information graphs are useful for Bittman’s response to existing critics of the ‘cooking at home is better’ movement who have tried to argue that though fast food may be more expensive on a per meal basis, it is actually cheaper on a per calorie basis because fast food is so calorie dense (if a bit too heavily reliant on nutritionally vacuous fats and sugars). Bittman uses the nutritional information graphs to refute this claim and I applaud the graphic designer for including the rebuff of the critics in the graphic. It would have been easy enough to simply run the photos of the meals with their price tags.

What needs work

The photos take up too much space. This almost looks like an advertisement for McDonald’s, chicken, and beans.

The nutritional information bar graphs are potentially confusing. They do not measure absolutes so much as they show how each of the home-cooked meals stack up against McDonald’s. Since people are not used to thinking of their meals in comparison to what they would have eaten had they eaten at McDonald’s, I’m not sure the comparative nutritional graphs work as well as one graph that used absolute data and had all three meals on it. I am almost positive the graphic designer probably tried making just exactly that graph – if they are out there reading this I invite them to send me what that looked like to prove that my hunch to use a unified graph on this one would have been ugly, confusing, or just plain wrong.

References

Bittman, Mark. (24 September 2011) Is Junk Food Really Cheaper? New York Times, Sunday Review. Op-ed column.

Bittman, Mark. (20 September 2011) Cooking Solves Everything: How Time in the Kitchen Can Save Your Health, Your Budget, and Even the Planet [e-book] published by Byliner.

New Drug Wave Takes Toll | Star Tribune "A Lethal Dose" series

This graphic was subset from a larger graphic. I trimmed off the third drug comparison because it was problematic for reasons I explain below.

New Drug Wave Takes Toll | Star Tribune "A Lethal Dose" series

What works

Tracking illegal behaviors can be extremely difficult because the people participating do not want to be arrested or fined. How then, do health investigators find out what risky behaviors people are doing in their leisure time? In this case, the investigative team on the Lethal Dose series at the Minneapolis – St. Paul Star Tribune newspaper used calls to the poison control center as a proxy for tracking the rise of newly available synthetic drugs. As journalists rather than, say, doctors, they do not have access to patient data. Using poison control center calls is not a perfect indicator of the spread of the new synthetic drugs, but they have followed up these charts with an entire series in which they interview parents and friends of victims as well as a retailer more than willing to defend his right to sell.

What works for me about this graphic is that the investigators found a fairly unbiased source of information about this drug use, something that helps tie the other articles in the series together. Interviewing stubborn retailers and grieving friends and family is part of what journalists do, but those interviews are so emotionally and politically charged that it I appreciate the presence of trend information.

Because these drugs are new, it was necessary to spell out active ingredients because the average person will not know. I appreciate that they included that in the graphic rather than in a footnote.

What needs work

The shading behind the bar graphs is frivolous. It adds no information and is not necessary to guide the eye. It could be dropped and nothing would be lost.

Trend data is better as a line graph than a bar graph because it is easier for the eye to follow a line and to compare one line to another line than to follow a series of steps and compare one series of steps to another.

This blog post focuses on two drugs that use the same axis. I would have kept the same axis for the third drug even though it’s use numbers are lower. Note that all of the drugs started with low numbers and rapidly climbed – perhaps the third drug family “synthetic chemicals” is simply lagging behind by a year or so. It is hard to make that comparison when the axis is so dramatically different from the other two. There is a danger in lying with graphics here – making the third graph seem comparable to the first two implies that the third drug poses an equal threat. The numbers do not support that assumption.

References

Star Tribune staff writers. (2011) A Lethal Dose: The war on synthetic drugs Investigative reporting series.

Star Tribune. (2011) “New Drug Wave Takes Toll” [Information Graphic] American Association of Poison Control Centers, DEA.

Trends in taking pictures of food | blog360i

What works

I appreciate the attempt being made here to break food photography down into a set of categories, separating the cataloguing from the art and the gross/unusual from the special occasions.

It’s nice to see that people are about as likely to be excited about their vegetables as they are to be excited about their desserts/sweets. Perhaps this tells us something about the class position behind the sustainable foods movement? (People with more money are more likely to have fancy phones and phone plans equipped for sending pictures of food around to friends, family, and blog readers. Folks who have more education and are more well-to-do are also probably the most likely to be participating in sustainable/local food projects that spotlight locally grown foods while they are still recognizable in their whole forms such as vegetables before they are incorporated into a more complicated dish.)

The icons are nicely drawn.

What needs work

The colors in the main donut are too similar, especially as they approach red, to be easily distinguished. Further, the areas of the main donut graphic (and the food-type smaller graphics) would have been easier for the human eye to ‘weigh’ if they had been presented unfurled as bar graphs rather than wrapped around each as hoops/donuts.

Wordles do not fall into the realm of useful information graphics. If there is something to be said about the use of particular words – in this case, if there is some importance tied to the intensity of the use of “breakfast”, “lunch”, and especially “dinner” – simply making those words larger relative to other words does not help readers understand any larger meaning to the pattern. In my opinion, if there is something important about word usage, the best way to explain the meaning behind that word usage would be to use…words. I would be interested in reading some paragraphs about why this pattern of generic food words “breakfast”, “lunch”, “dinner”, and “food” is meaningful. The same basic critique applies to most wordles.

The images of the phone, the polaroids, and the door opening at the bottom of the graphic take up tons of space and communicate almost nothing. Personally, I am also not convinced by the argument that since people do not mention brands in their food photography that there is a “huge opportunity for marketers” in the day-to-day practice of food photography.

Overall, there is a glaring lack of context for this information. Even as descriptive information, it is hard to make sense of food photography as a practice without knowing more about the people who are actively doing it. Is it older or younger people? What’s the gender/race breakdown? Is there a core of photographers who are snapping tons of pictures while the rest of the population barely takes any? Many questions remain.

Reference

Wasserman, Todd. (9 May 2011) “What’s behind the food photography trend?” on mashable.com.

360i (2011) “Online food and photo sharing trends” available at scribd.

Philosophy is concerned with questions of perception. Does what I have learned to call ‘red’ elicit the same sensory experience for you? Or are we seeing two different things that become equivocal only through language?

I cannot answer that question.

But I was thinking about it recently because I spend a lot of time thinking about how physical things cross boundaries into digital space. What gets translated well? What is lost? And are there properties of physical objects that are actually richer in digital space than they were when they were physically tangible?

The Shape of a Song
The Shape of a Song

Seeing sound

Coming up with ways to visualize sound is not new. Musical scores ‘show’ players what they are supposed to do in relation to all of the other players. But any good player knows that the score is no substitute for figuring things out together – there is always more to be worked out than the score would seem to allow.

The project “Shape of a Song” by artist Martin Wattenberg and crew takes MIDI files and uses them to map out repetitive elements in songs in order to ‘see’ the patterns in the song.

The shape of "Mary Had a Little Lamb"

I found this to be quite enlightening, at least with respect to repetitive musical elements. It doesn’t do much for pitch, tempo, or anything else critical to song-making. The point is not to detail what is missing here, the point is that seeing the song diagrams helped me to think differently about the experience of listening to songs.

The shape of "Clementine"

This brought me back to the original quandary about whether humans perceive sensory input equally or differently. It seems to me that trying to depict sound as visual or the emotional register of an afternoon as sound requires border crossings, translation processes, that help pin down the original perceptual experience in such a way that it becomes more possible to assess whether the original perception is a shared experience.

The medium for this exchange seems to be a combination of emotion and hard-wired neurology which are not mutually exclusive categories. This isn’t a blog post about those questions. It is a blog for exploring the way that translating a perceptual experience – like hearing a song – into a visual infographic can change our understanding of the element (i.e. the song) in its original format.

First, just translating something into a visual medium might alter the emotional register. Colors are thought to have emotional registers. I’m not going to get into color theory in any kind of depth, but there have been a number of studies, some from evolutionary biology, that have shown red and orange to be routinely associated with danger. Thus, using them in graphics can evoke heightened awareness much like a little burst of adrenaline in a fight-or-flight situation would. Blue is supposed to be more calming; that’s probably why it is the go-to color for corporate America. All of the marketing people will have had color theory 101 beaten into them.

Secondly, translating a perceptual experience into something quantifiable offers are fairly rigid and particular framework for taking measurements and making assessments. I have a feeling that the quantitative turn itself has just as much impact on the interpreted meaning of the piece as the translation into a new perceptual format.

The shape of "The Goldberg Variations"

For ethnographers

Why are these questions about translation coming up? Because ethnographers – those whose craft is translating observations into written words – are constantly occupying themselves with the task of translating experiences and thoughts (often rather layered thoughts) into a static more-or-less linear narrative. Sometimes looking at how translation happens in another context – like from sound to image – can help isolate the process of translation so that the work of that mechanism becomes more obvious.

References

Wattenberg, Martin. (2010) “The Shape of a Song” at turbulence.org

The Growth of US Newspapers, 1690-2011 from Geoff McGhee on Vimeo.

This animation is taken from the interactive data visualization of the Library of Congress’ “Chronicling America” directory of US newspapers. It shows all newspapers in all languages in the US from 1690 to 2011. View the full visualization at http://ruralwest.stanford.edu/newspapers. Created by the Rural West Initiative of the Bill Lane Center for the American West, Stanford University. Visualization by Dan Chang, Krissy Clark, Yuankai Ge, Geoff McGhee, Yinfeng Qin and Jason Wang.

What works

This visualization of the rise and fall of newspapers in America is interactive and not to be missed. Click over to the interactive visualization (or open it in a new window) and then come back and read commentary. The folks at Stanford’s Bill Lane Center for the American West have used Library of Congress records to create what they say, “would be fairer to call a “database” visualization than an omniscient creator’s-eye view of the growth of American newspapers”.

The trick with any kind of database visualization is that there is often way more information in the database than can comfortably fit in the first graphic representation that comes to mind. The folks at Stanford have done a masterful job.

Here are all of the variables I could pick out that are built into this graphic without overwhelming viewers with too much information:

  • Time | They embed a timeline at the top and turn the whole image into snapshots across time. The time variable is critical to their message.
  • Location of newspapers | They used a map with dots on it to show where these newspapers were being written. I am not always a fan of maps, but in this case, they needed to use a map because another main part of their message is the geographical distribution of newspapers, especially in the American West.
  • Number of newspapers per city | Each city is marked with a dot that grows and shrinks over time as the number of newspapers in that location grows and shrinks.
  • Language in which newspapers were written | The color of the dots correspond to one of seven languages, plus an 8th color for “other” languages. There is also a gray dot that represents all of the newspapers of any language. The languages and the pan-language grey dot can be turned on an off so that it is possible to see, for instance, just the changes in Spanish language newspapers.
  • Publication frequency | This is a filter option that allows users to see only daily or only weekly/biweekly or only monthly+ publications.
  • Textual description | There is a narrative about newspapers that is important to the authors as well as to us as readers/viewers trying to understand this massive amount of data. They chose to use 3-4 sentences to describe major changes every 10 years or so, less often before 1900. I found this to be the right amount of text – brief enough so that it didn’t overshadow the infographic, but dense enough so that it contained substantive material. Instead of trying to display major historical events on the map somehow, they use the text to mention things like the Civil War and Great Depression which allows them to describe the impact of these events on newspapers in particular.
  • Actual titles of newspapers by city | If users click on a particular city at a given moment in the timeline, they can see a list of all the titles of the newspapers that were being printed at that place and time. The languages of the newspapers correspond to the color coding system for languages used throughout the graphic. If users want additional information about any of the titles, they can click on the title and be taken to the entry for that title in the Library of Congress database.

I couldn’t be more excited (or proud) of this project. [Full disclosure: I am not personally acquainted with anyone involved in the project.] Please go play around with it this weekend. Even if you are not interested in newspapers, it is impressive to see how they managed to create such a thorough graphic – a database visualized – without making it impenetrable.

More information about newspapers, the west, and rural America

For more on these issues, the team at Stanford has also released two written reports on this topic: Rural Newspapers Doing Better Than Their City Counterparts and did the West Make Newspapers or Did Newspapers Make the West?.

References

Bill Lane Center for the Study of the American West at Stanford University.

[Graphic: Data Visualization: Journalism’s Voyage West]

Library of Congress: Chronicling America Project

Blog reading and writing graph by gender, 2000-2010 | Pew Internet Research
Blog reading and writing by gender, 2000-2010 | Pew Internet Research

What works

This graphic was created using a wonderful, if not entirely complete, massive Excel spreadsheet summarizing interview results from the Pew Internet Project. There are many more questions than the three I looked at. I am primarily interested in how many adults write blogs and I was happy to see that the Pew Internet Research center has been asking adults about their blog reading and writing practices for about a decade. Just to give it context, I also plotted the percentage of adults using the internet at all.

I am also interested to see that women and men write blogs at about the same rate, these days, even though I know that they aren’t writing the same kinds of blogs. Food bloggers, for example, are overwhelmingly women as are baby bloggers (aka mommy bloggers, but using the term ‘mommy’ is too gender-restrictive). Political bloggers and tech bloggers tend to be male more often than not, though I know less about them.

What needs work

The interviews are different from year to year – some years I was averaging five or seven data points on the same question and some years I had only one (or, sadly, none). I wish there had been more years of data available on blog reading, for instance.

If I had one takeaway point it would be that we need to keep funding places like Pew to conduct detailed, ongoing research. I have found it invaluable to have access to their research and it makes the work I am currently conducting about food bloggers relatable to a wider body of practices.

References

Pew Center for Internet Research. Usage over time spreadsheet.
— If you cannot click on that link and automatically start a download, try downloading it from the Pew website

Food Blog Study | Web Crawler Progress Egg

Food Blog Study Update

I heard there was a graduate student once who used egg timers to break her dissertation down into writeable chunks. She had these timers all over the apartment, flipping one over to start a new bout of writing. Once it ran out, she might keep on writing since there was no buzzing or beeping to interrupt her. If she looked up and the sand had all run through, she would flip over another egg-timer to measure out a dose of ‘free-time’. Maybe I had her strategy in mind while I was trying to come up with a way to monitor progress on the food blog study. Large, long-term projects can envelope me, making it hard to see either where (and why) I started the project and where I mean to end up while I’m toiling away in the trenches of the day-to-day. This post is not about a final product. Rather it is about how I use information graphics to help me keep my mind on both the questions I started with and the place I mean to end up when all is said and done.

The food blog study is broken into three parts. The interviews (N=22) have all been conducted and are out being transcribed. The survey cannot begin until the web crawler has gotten to a stopping point. So where do things stand with the web crawler? That is not an easy question to answer except to say that it is doing what good bots do, chugging along finding food blogs to add to its growing collection with minor down times for maintenance here and there.

The graphic above demonstrates how the network set is growing – I simply used the file size of the daily cumulative db output to tell me how big to make each day’s egg. Still, looking at file size is kind of silly – it does not help me figure out when the network has been sufficiently crawled. It simply represents the absolute size of the database and because I do not have some target absolute size as my endpoint, knowing the current absolute size is mere trivia and not analytically useful.

Rather than considering absolute size or the linear growth of the network data, it is a lot more meaningful to examine the rate of change of new nodes from one day to the next. For comparison sake, I graphed both the linear growth of the network (top graph) and the number of nodes added per hour for each day in July (bottom graph) with the exception of July 17th when the crawler was down for maintenance. The linear growth is chugging along consistently enough with a few exceptions for reasons like maintenance and accidents (someone unplugged my computer from the internet for six hours one day. oops.). The rate of new food blogs added to the network set per hour is finicky, a pattern that is much easier to see in the bottom graph. That graph was calculated by taking the number of new food blogs added to the network during a given run and dividing it how long the run lasted to generate an hourly rate of growth. That hourly rate is what is plotted below – the crawler’s sweet spot seems to be when it is adding about 60 – 90 new food blogs per hour.

Food Blog Study | Graphs of Web Crawler Progress

The plunge in the rate of new blogs added per hour around the 18th of July is artificial. I happened to add a command that day which retroactively removed all of the blogs primarily focused on cocktails, wine, and beer. Their removal nearly outweighed the new food blogs that were added to the network that day so the overall rate of new blogs added appears to be extremely low at only 6 per hour.

This graph is extremely useful for keeping in mind where I started and helping me to figure out when I have gotten some where. I will know that the food blog bot is exhausting new nodes and that I have started to run into the bounds containing the food blog network when the rate of newly discovered food blogs per hour starts dropping and does not recover. Right now, the crawler is still pulling in new entries fairly rapidly so I know I am probably going to be babysitting it for at least another week. Thus far, the roughly-cleaned network includes about 32,000 nodes. Yes, folks, that means there are greater than 30,000 food blogs out there in the world. Probably a lot more, especially because the bot speaks food in English, Spanish, French, Italian, and German so the network under consideration is multi-national though not quite global.

Note on graphics

Could that egg have been perfectly round? Yes. And would perfectly round circles have been easier for average humans to measure with their eyes? Yes. So why did I choose an egg shape? Because I feel like this project is an incubation period. Data collection can be a delicate process – I would say that is especially true with respect to the web crawler because it was a tool custom-built for this project and thus has not been used and tested elsewhere. I also chose an egg because it is not important if viewers understand exact figures – this graphic was intended to provide an impressionistic view of the rate of growth of the network that the crawler is gathering. It grows incrementally, not by leaps and bounds. Like tree rings, the concentric nature of these eggs demonstrates that some days generate fatter rings than others.

As for the two graphs, I wanted to try using the same horizontal access because I wanted to make sure people understood that those two graphs are best understood as a pair. Basically, one is the derivative of the other, though there’s no need to pull out your calculus textbook just to understand these two. The top one just shows the total number of food blogs in the network so far. The bottom one shows how fast new blogs are being added from day to day. I didn’t want to clutter up the graphs with too many words so I opted to go with a single horizontal access, short titles, no labels for the vertical access (they are implied in the title), and I kept the two points about strange days outside of the bounds of the bottom graph. I don’t know if it is acceptable to stick asterisks in a graph, but I did it.

References

Noren, Laura. (2011) Food Blog Study.

Anatomy of a Cupcake | Allen Hemberger

What works

Not all information graphics arise from the same design process. In this case, the graphic creator went so far as to make a video of the creation process so, if you are so inclined, you can click through to Allen Hemberger’s “Things” blog to see how the Anatomy of a Cupcake went from sketch to photography and then to poster-sized graphic. If you love it maximally, you can even buy a print. [Note: If you like Hemberger’s work he has a food blog “The Alinea Project” and a photography blog.]

I chose this image for three reasons: first, I love that Hemberger took the time to make a video showing the process of going from idea to a tightly composed stylized photograph. Second, I am always happy to find people who construct information graphics differently. This one is a hybrid between photography and baking. What makes it work is the proper execution of both the baking and the photography as well as the care that was given to the original sketches that determined the storyboard for the idea. If the flow chart failed, he could have had the same cupcake components and the same photographic skills, but ended up with something that was merely ‘cute’ rather than something that is simultaneously aesthetically pleasing and clever.

The third reason I chose this image is even more personal than the first two. My summer research project, funded in part by Microsoft Research in Cambridge, MA, uses food blogs and food bloggers as a lens for focusing on the tensions between material and immaterial creative skills. I’m interested in figuring out how people move between the material world in which all of their senses can engage with a process and the not-quite-as-material world of the web in which the sensory world is reduced to the visual (though in some cases there is an audio component). The rest of the sensory experience of the material world has to be represented by text, photography, and graphic design. Why are there so many food blogs when food is something that has long been understood as a part of the material world that has to be tasted and smelled in order to be experienced properly? Why do people choose to blog about food and what keeps them going? Making and serving food are also ritualized practices for building connections between people – it is one of the primary physical elements through which culture is expressed. How does the collective experience of food work online?

The project has three components:

1. A web crawler is out poking around the English-speaking portion of the internet, creating a network of all of the food blogs that are linked in some way to an initial list of 50 top food blogs. So far, we have about 22,000 blogs in the English-speaking food blog network. Visualizations coming in another 6 weeks or so. The point of the web crawler is to see how many food blogs there are, how they connect to one another, and whether or not there are discernible lobes of the food blogosphere (say, for instance, a vegan lobe or a molecular gastronomy lobe). Because the food blog network is a grassroots sort of place – very few people are getting paid or prodded to start blogs and they are then free to link to whomever they want – there are some interesting social network questions we can answer about self-selecting networks. For instance, how many outlinks do food bloggers use? Is there geographical clustering or is the network oblivious to geography? Are bloggers who are more heavily linked to (or from) more likely to keep at it?

2. Once the crawler begins to reach a plateau in terms of adding new links, we will stop it, clean up the returns a bit, and then take a random sample of blogs who will receive an invitation to participate in a web-based survey. The survey does three things: it gathers blogger demographics (gender, race, age, kids or no kids, location, education, income), demographics of the blog (proportion dedicated to restaurant reviews vs. recipes, frequency of posts, perceived and measured audience, site traffic, comment traffic, presence on twitter and facebook, amount spent and earned), and the survey finishes with a few questions about motivations and perceptions of one’s blog.

3. To help construct a good survey instrument and to deepen the context within which the analysis of the survey results will take place, I am also interviewing 20-25 food bloggers. So far, the interviews have been fantastic. They are much better at getting at the nuances of practice – especially the crafting practices that are part of cooking/baking and blogging (photography, writing, graphic design, and online social networking…this last one may not be a craft practice).

All of this has been taking up a significant portion of my time and keeping me away from the blog. However, as the data comes in, I will have an opportunity to make graphics from scratch, rather than critiquing other people’s work all the time. I start to feel a bit like Oscar the Grouch when I’m in the midst of a string of critiques, especially since I know my own work is far from perfect.

If this blog uses the first person more than normal, it is because I have been reading so many food blogs where writing in first person is the norm. This just goes to show: if you want to be a good writer, be a good reader. The linguistic and grammatical styles we read eventually start to influence the way we speak and write.

References

Hemberger, Allen. “Anatomy of a Cupcake”.