What works
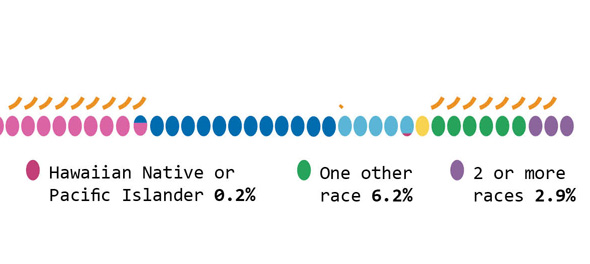
This graphic does a great job of depicting race and ethnicity as distinct concepts. The orange hash marks above the racial groupings indicate the proportion of people in the racial categories that are also Hispanic by ethnicity. I made this to correct the graphics that lump race and ethnicity together (and – bafflingly – they still add up to 100%).
Race and ethnicity are not the same. Race refers to differences between people that include physical differences like skin color, hair texture and the shape of eyelids though the physical characteristics that add up to a social decision to consider person A a member of racial group 1 can change over time. Irish and Italian people in America used to be considered separate racial groups, based in part on skin color distinctions that most Americans could no longer make. What does “swarthy” look like anyway?
Ethnicity – a closely related concept – refers to shared cultural traits like language, religion, beliefs, and foodways. Often, people who are in a racial group also share an ethnicity, but this certainly isn’t always true. American Indians are considered a racial group but there are hundreds and hundreds of distinct tribes in the US and their religions, beliefs, foodways, and languages vary from tribe to tribe. Hispanics in America often share common language(s) (Spanish and/or English) but they may not share the same race. At the moment, most Hispanics in America self-identify as white. I have often wondered if, when I’m 60, the ethnic boundaries currently describing Hispanic people will have faded away, much like the boundaries describing Italian and Irish folks faded away, becoming more of a symbolic ethnicity that can become more important during the holidays and less important during day-to-day life.
What needs work
The elephant on the blog is that I have been on hiatus since February. I’m writing my dissertation and I plan to stay on hiatus through the spring to finish that. My decision may seem irresponsible from the perspective of regular readers and I apologize for my absence.

As for the graphic, it was designed to run along the bottom of a two-page spread so it does not work well here on the blog. If anyone wants a higher-resolution version to use in class or in a powerpoint, shoot me an email and I’ll send it.
References
US Census, 2012 using 2010 data.

