
Art and infographics intersect
Artist R. Justin Stewart has taken infographics into the third dimension. His work is more art than information but it’s clear that it builds on the visual tropes of information graphics.
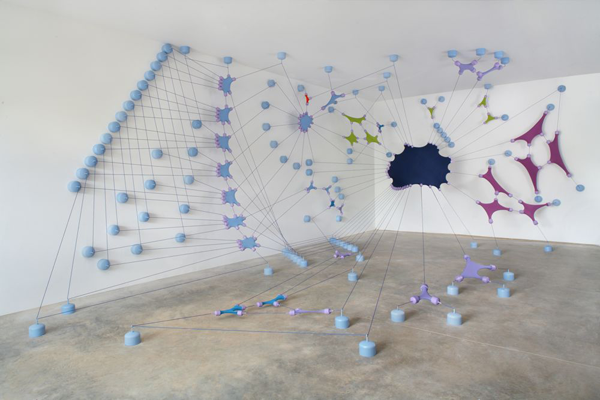
The first image depicts the way that ex-Google workers dispersed into new jobs after their time at Google. The point is not that any of us happen to care deeply about Google workers – someone does but probably not the readers of this blog – but to see how Stewart depicts network graphs in actual space.
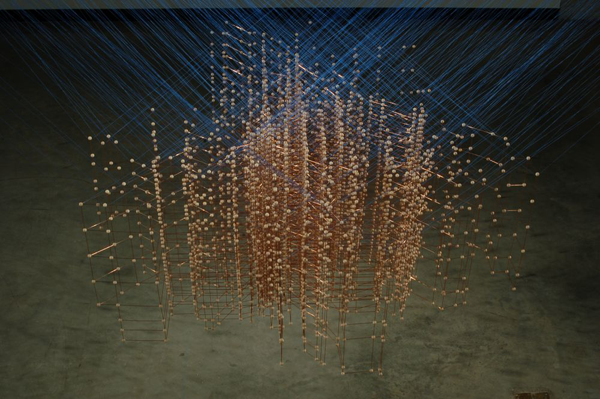
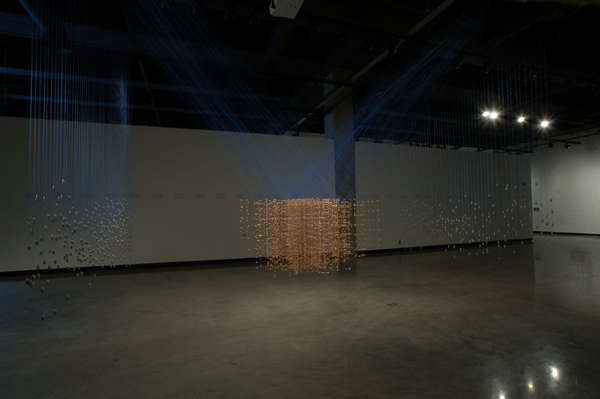
The second two images depict a transit system in Minneapolis over a twelve hour period on a Sunday morning. It’s elegant but far too abstract to ‘work’ as an infographic. This is not a critique – I do not think Stewart wanted to make literal art – but it does not take much creativity to see that it would be easy to layer more information onto the artistry of the presentation.
My major contribution to this discussion and the reason that I decided to post Stewart’s work is that much of the art that has been inspired by the data revolution has happened in digital space. We have seen some amazing pixel-based animations and visualizations on this very blog. But I have not come across too much work in three dimensions, real space, that shares so many conventions with information graphics or data-based ways of knowing. A million points tell a story. Usually they tell that story in the same digital realm in which they were born, but Stewart takes them offline into actual spaces. They get installed. He has to come up with the way he wants to represent intangible information with tangible physical components.