
What works
This idea is so simple and demonstrates the reason tables are great as well as the reason trend lines are great. In general, tables are capable of organizing more information than most information graphics. Sure, you can have small 2×2 tables but there can also be tables that go on almost to infinity (or so it seems if you are asked to turn them into an information graphic). But tables are extremely flexible and this is just one simple example of how they can accommodate trend lines.
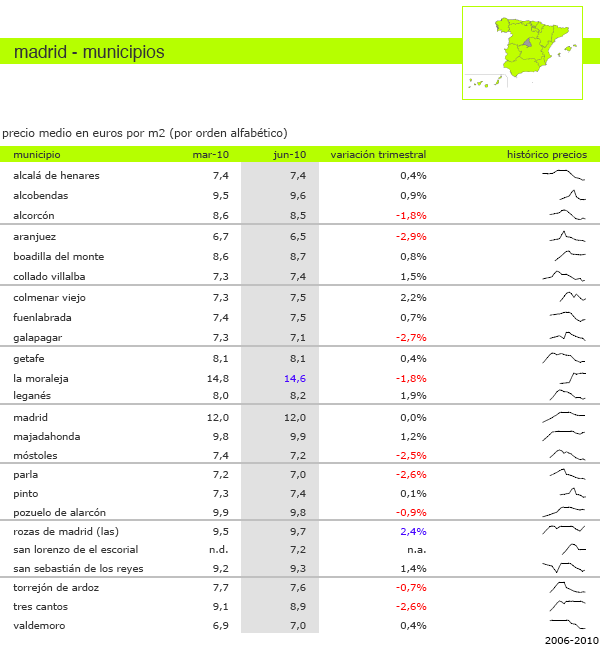
The folks at idealista.com prepared a report covering second trimester rental prices in Spain and above you can see what has been going on in the neighborhoods of Madrid. They include the numbers as well as trend lines that demonstrate in a glance the recent history of prices in those neighborhoods. It isn’t rocket science to stick those trend lines right in the table, but it is useful. This should also remind all of us that trend lines are legible even when they are very small.
What needs work
Those trend lines need at least a start date and an end date. It is tempting to think that they start at the beginning of the trimester and end of at the end of that trimester but it is unclear (and unlikely, in my opinion). Plus, some of the trend lines seem to start up in the middle rather than at the beginning.
Rental prices in Spain – 2010
In case you came to this blog because you are, in fact, concerned about housing rental prices in Spain, here’s a summary of the report. While there have been statistically significant but small price changes in some markets, in Madrid and Barcelona, rents are basically holding steady.
References
idealista.com (2010 16 July) Evolución del precio de la vivienda en alquiler [Rental housing price report]
Comments 2
Madrid hot news » Alquiler en Madrid – Trend lines in tables » Graphic Sociology — July 16, 2010
[...] Read more from the original source: Alquiler en Madrid – Trend lines in tables » Graphic Sociology [...]
General Model for the Structure of Society? | wangmo — July 22, 2010
[...] Alquiler en Madrid – Trend lines in tables » Graphic Sociology [...]