
Data Based is a weekly Cyborgology feature producing original, insightful, and fun data visualizations.
visualization
Data Based is a weekly Cyborgology feature producing original, insightful, and fun data visualizations.
Data Based is a weekly Cyborgology feature producing original, insightful, and fun data visualizations.
This is the second installment of Data Based, a weekly Cyborgology feature producing original, insightful, and fun data visualizations.
Data Based is a brand new Cyborgology feature producing original, insightful, and fun data visualizations.
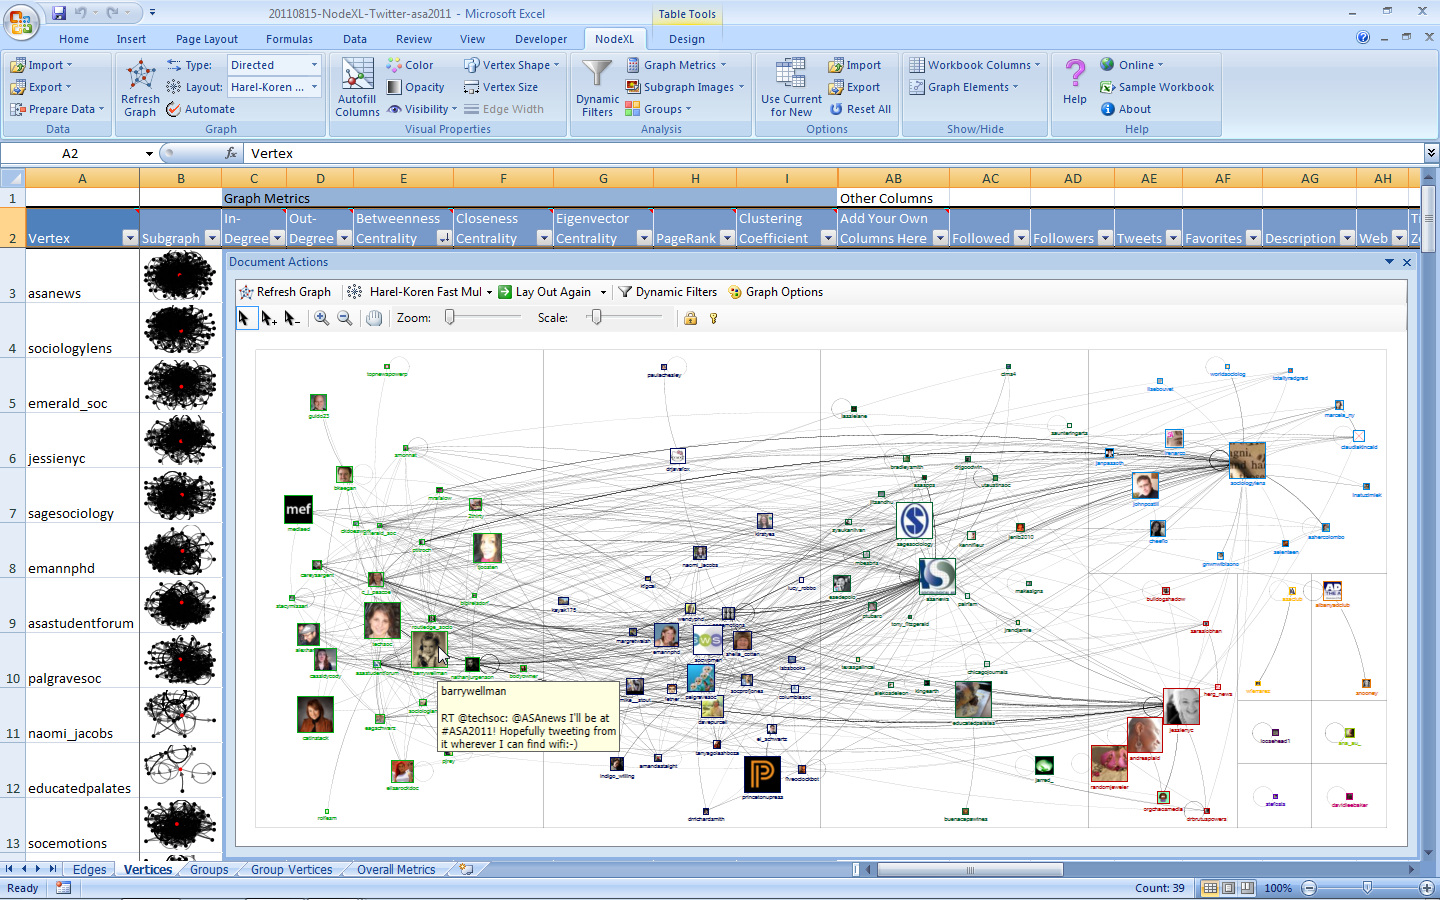
The 2011 American Sociological Association Meetings are about to start this week in Las Vegas, Nevada.
As the conference gets underway, the volume of tweets containing the #ASA2011 hashtag is rising.
Using NodeXL, I collected a set of tweets with the #ASA2011 tag and mapped the connections among the people who tweeted that term.
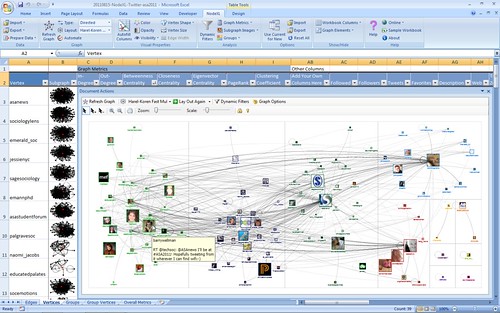
These are the connections among the Twitter users who recently tweeted the word ASA2011 when queried on August 15, 2011 more...
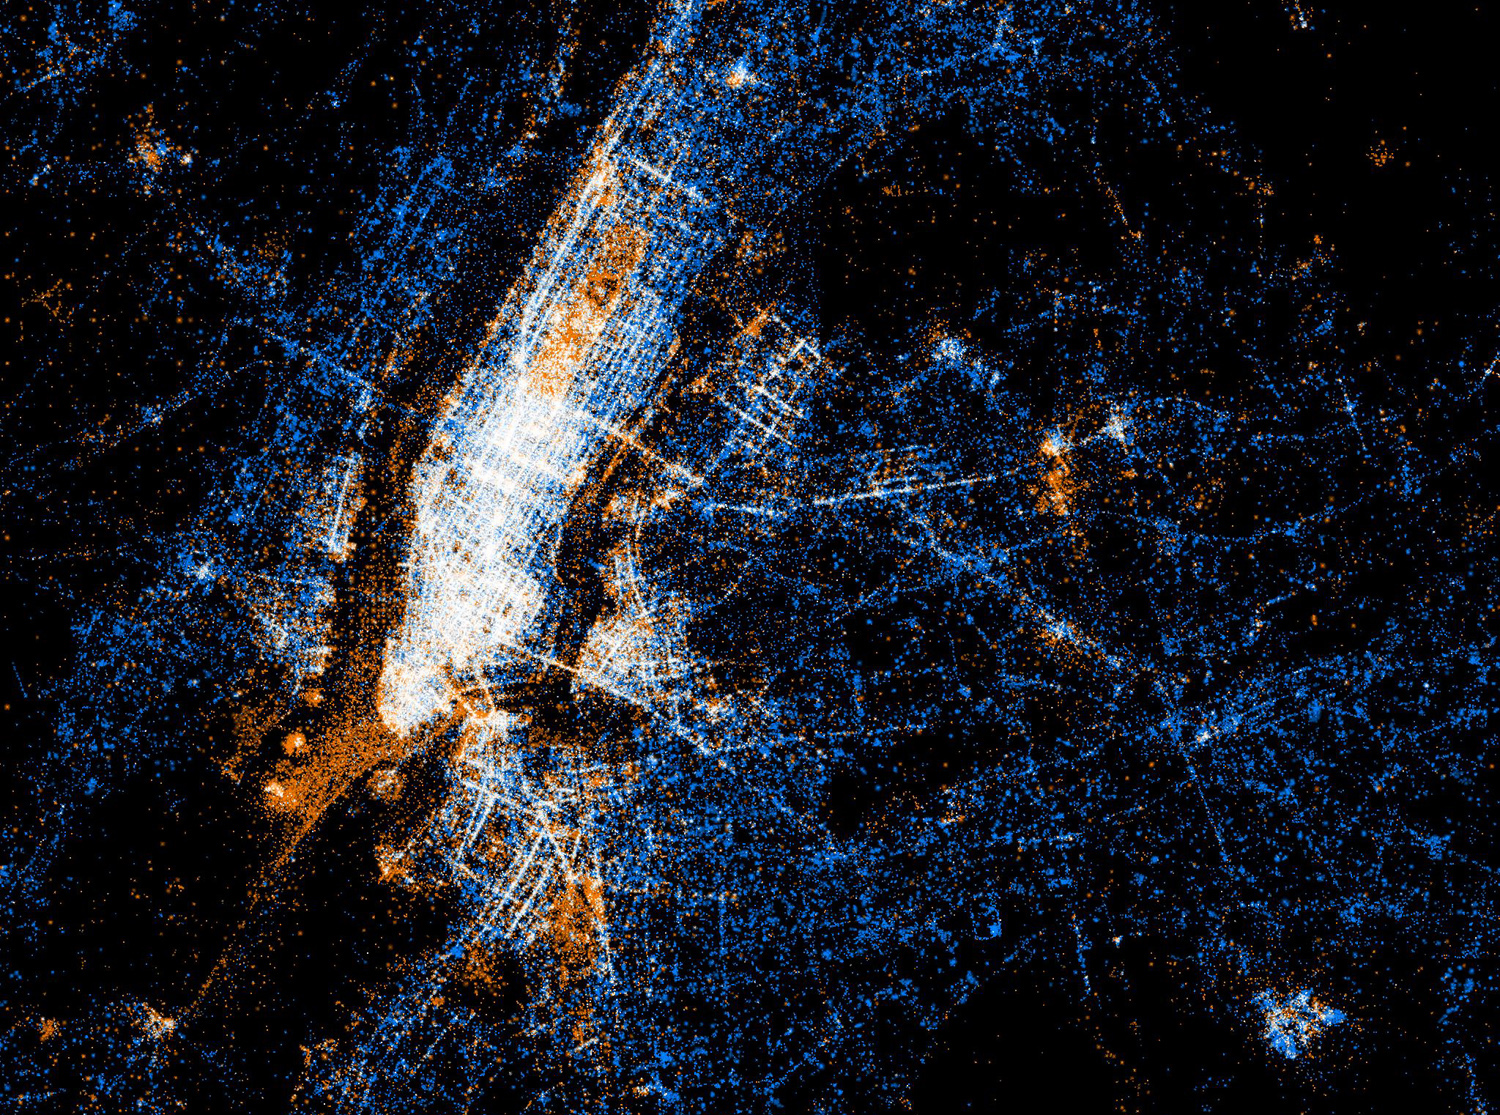 The orange represents the intensity of Flickr images taken and geotagged to a particular area. The blue is Twitter use. Looking at New York City above, we see that people tweet from different places than they photograph. For example, tourists photograph some areas while people tweet more from work and home.
Project Cascade from the New York Times seeks to visualize how news stories break and are disseminated online. By illustrating how stories explode through the social web it provides a glimpse into our highly networked information society.
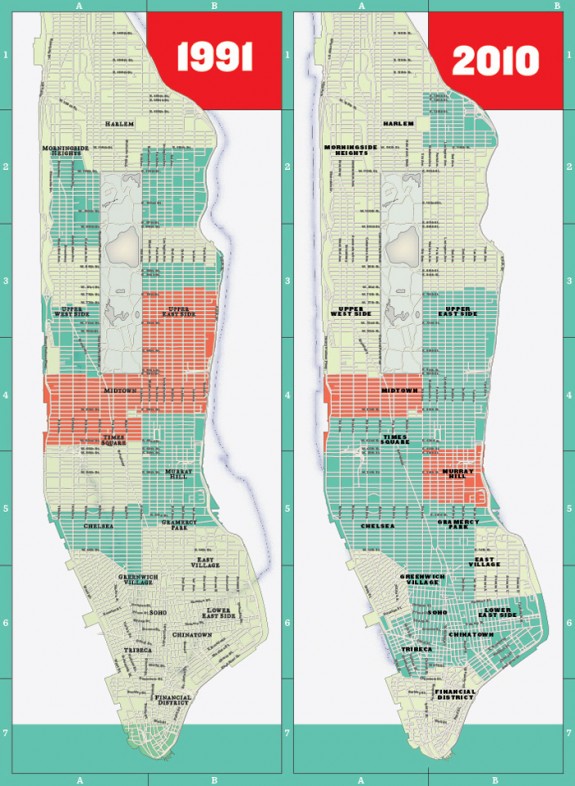
FlowingData posted this great infographic that shows how prostituion in Manhattan is increasingly dispersed. The Internet allows sex work to be less anchored by physicality when much of the process happens online. More analysis here.

Data Based is a weekly Cyborgology feature producing original, insightful, and fun data visualizations.
Data Based is a weekly Cyborgology feature producing original, insightful, and fun data visualizations.

This is the second installment of Data Based, a weekly Cyborgology feature producing original, insightful, and fun data visualizations.
Data Based is a brand new Cyborgology feature producing original, insightful, and fun data visualizations.
The 2011 American Sociological Association Meetings are about to start this week in Las Vegas, Nevada.
As the conference gets underway, the volume of tweets containing the #ASA2011 hashtag is rising.
Using NodeXL, I collected a set of tweets with the #ASA2011 tag and mapped the connections among the people who tweeted that term.
These are the connections among the Twitter users who recently tweeted the word ASA2011 when queried on August 15, 2011 more...
The orange represents the intensity of Flickr images taken and geotagged to a particular area. The blue is Twitter use. Looking at New York City above, we see that people tweet from different places than they photograph. For example, tourists photograph some areas while people tweet more from work and home.
Project Cascade from the New York Times seeks to visualize how news stories break and are disseminated online. By illustrating how stories explode through the social web it provides a glimpse into our highly networked information society.
FlowingData posted this great infographic that shows how prostituion in Manhattan is increasingly dispersed. The Internet allows sex work to be less anchored by physicality when much of the process happens online. More analysis here.