
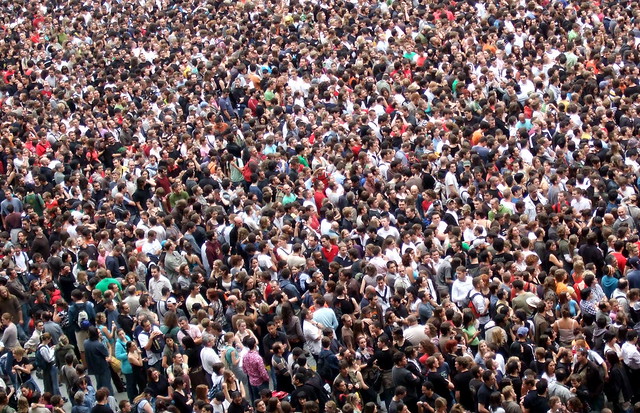
For most of human history, the world population has been much smaller than it currently is — the population has grown substantially only in the last two centuries, as technological and medicinal advances increased life expectancy. Social scientists now say that this growth will end within this century, according to a recent article in The Atlantic. By 2100, when the world population will be approximately 11 billion, growth rates and death rates will be relatively equal; while the population will continue to grow in some parts of the world, other regions will bear aging, smaller populations. Thus, though the numbers seem to equalize, human demographics could look quite different than they do now. Based on these population considerations, the 2100 world could witness many social, political, and cultural shifts, both on a local as well as a global level.
To begin, shifting populations could shape family structures and cultural production.
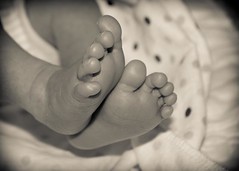
- Traditional family structures may change in places where most people currently have large, extended families. Sociologist Parfait Eloundou-Enyegue explains that some of these places will experience smaller fertility rates, leading to smaller families. This could change traditional family structures in some countries as large, extended families give way to smaller, nuclear families. The family reunion may be less lively, but it’s not all bad; as families get smaller, parents can invest more time and resources into their children, whether it’s being able to afford better schools or giving the kids their own room.
- Art, music, theater, and other forms of culture are often clustered around larger, urban environments with youthful populations. As demographics change and certain parts of the world become relatively younger than others, we could see a shift in dominant produces or culture and entertainment. For example, marketing and producing sports has already changed as certain parts of the world have grown while others have shrunk. For several parts of the world that have been often overlooked in global culture and entertainment, this could be their big break; break a leg!
At the same time, the population plateau of 2100 could spark tensions and challenges, particularly for economics, political interests, and social policy.
- The world population will be collectively older than it is now, and a much larger proportion of people will be of retirement age. This could cause political and policy shifts in many countries, particularly those with social spending programs that support the retired and elderly. Often, these are paid for by the employed persons in the labor force, a group that will be comparatively younger and smaller in the future; this will likely cause shifts in how social services operate and receive funding. Furthermore, since such programs are often key political issues, changing populations could spark shifts in the political arena based on different interests and agendas across age groups.
- By 2100, the global environment and climate could look much different than it does now, and the population is estimated to plateau just below 11 billion people. Climate change affects different parts of the world in a variety of ways. Across the world, some populations will shrink and age in comparison to others. Thus, different countries’ social and political responses to environmental issues will likely reflect considerations of their different population needs.
Of course, these population predictions are just predictions, but they are informed by complex tools and methods in demography; such analyses are built on hard data regarding the world population and trends in fertility and birth. Thus, even if there are some fluctuations in the numbers, the general trend towards an aging population in some regions and a younger population in others will remain. Overall, this could lead to many social, cultural, and political changes.
The world may stop growing, but the population plateau could still cause many shifts and shake-ups; change really is the only constant.


 The
The