jimi adams is an Associate Professor in the Department of Health and Behavioral Sciences at the University of Colorado Denver, and affiliate faculty at the Institute of Behavioral Science at CU Boulder. His research focuses on how networks constrain or promote the diffusion of information and/or diseases through populations.
What’s a
Model Modeling?*
Two of the most prominently cited figures from US-focused COVID-19 models include estimated deaths between 100k and 2.2 million. How can the public make sense of differences that are more than an order of magnitude apart? It could lead many to throw up their arms, not seeing why we should trust any models. My hope is to convince you otherwise. Models can be useful tools for those of us who are interested in knowing where the pandemic is heading, but doing so requires building some common understanding of why various models are built, the diverse strategies available for accomplishing those aims, and the substantial uncertainty inherent in all models. Without this understanding, we are attempting to compare metaphorical apples and oranges — if not apples and dump trucks — and poorly equipped to meaningfully assess those differences.
Here, I hope to help with that a little, by differentiating between:
- What models aim to accomplish.
- The mechanics of how they do that.
- The importance of uncertainty in all modeling approaches.
What’s a Model for?
By
now, everyone’s probably heard some variant of Box’s aphorism:
“All models are wrong, but some are useful.”
If nothing else, when encountering a new model, this should lead anyone assessing its utility to ask “Useful for what?” That is, before attempting to interpret any model, we should ask what it’s trying to illustrate in the first place. All models simplify reality, and do so in order to draw our focus to some portion of that reality. In practice, those typically focus on one of (at least) three aims: (1) explanations, (2) scenario-based projections, or (3) forecasts. At the simplest level, you can think of explanations as providing an account of how something happened, projections as providing predictions about what would happen under certain hypothetical conditions, and forecasts as indicating what can be expected to happen.[1] While I’m simplifying the distinctions here, it will help us consider the differences between varied modelling approaches, the different details reported from those models, and how we can make sense of those differences as we encounter the myriad models now circulating across the globe.
Explanatory models
“What’s our best estimate of what happened?” When sociologists refer to models, this is the type we most often have in mind. These generally attempt to test causal claims about how something came about. Note the past tense. Explanatory models are generally temporally backwards-facing — addressing why things happened the way they did. Thus far, explanatory models have not been the primary type deployed to make sense of COVID-19, because they generally try to account for things that have already happened. A few important examples have arisen showing racial disparities in exposure to the SARS-COV-2 virus, differences in complications among those who are infected, or demonstrating how the differences in countries’ age distributions account for variability in estimates of mortality rates. An important set of models of this type used phylogenetics to demonstrate that the virus had been circulating in the Seattle area for weeks before it was first detected.
Projection models
“What’s
likely to happen, if we do XX?” Projection models try to answer what we expect
to happen under different scenarios. In almost no case do we actually
think the results from projection models will happen. Instead, projections help
us motivate and inform policy decisions about what types of interventions can
be expected to have what types of benefits. A logical starting place for projection models in a pandemic is to ask what
would happen if we didn’t take any action at all? No epidemic modeler is advocating that we do nothing, so
they do not expect such projections to come to fruition. Instead, this baseline
scenario becomes the benchmark against which we can predict the potential benefits
of different intervention scenarios.
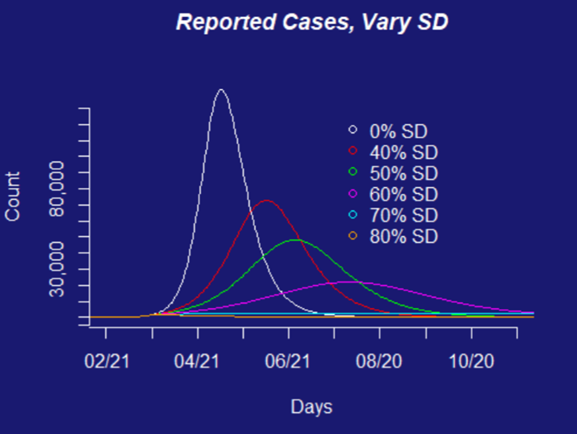
The scenarios our team has been working with are based on the types of policies that governments could put into place — social distancing measures that restrict how many people are going to work or school, or close access to social locations like restaurants, bars, and parks, travel restrictions, use of face-masks in public, etc. These types of interventions can be estimated for their combined effects if implemented together (e.g., by using aggregate travel reductions to estimate the effects of social distancing requirements on the face-to-face interactions that facilitate transmission of the virus). Alternatively, each scenario can be introduced individually into models to estimate the differential effects of particular aspects of specific interventions (e.g., if we close schools, but keep workplaces open).
Forecasts
“Where are we likely to end up?” Forecasts combine expectations about which conditions are likely to occur with estimates from projection scenarios, in order to estimate which outcomes the teams think are likely to actually arise. Here’s the thing about forecasts - they’re often what the public most wants, and what epidemic modelers are most hesitant to provide. We’ll get to why in the interpretation of inputs and outputs below (particularly uncertainties therein). One of the biggest difficulties with forecasts is incorporating how interventions that shape the various projection scenarios will alter the relevant behaviors, and therefore the outcomes of interest in the pandemic’s trajectory.
What do models produce?
Each of these types of models can be
used to account for a range of potential outcomes. In the case of a respiratory
disease like COVID-19, the outcomes of interest are generally (1) counts of
things like how many people we’d expect to become
infected, how many of those infected would show symptoms, need hospitalization, require a ventilator, and potentially die from the
disease or its complications, or (2) estimates of how that same set of outcomes
would be differentially distributed across subsets of a population (e.g., by
sociodemographic characteristics, geography, or health-care catchment areas).
Models are inherently uncertain
things. So, when talking about these outcome estimates, epidemic modelers
prefer to present the range of estimates their models produce. This is
why epidemiologist Marc Lipsitch said, early in the pandemic, that, if left
unchecked, somewhere between 40–70% of the global population (a range he later revised to
20–60%) was likely to become infected. However, when learning about such
modeling efforts, the public and policy makers alike often want nothing more
than a single number to inform their expectations or to justify policy
decisions. And these consumers of models may hear the reported ranges as overly-hedged, or even not
very informative. Lipsitch and other modelers would tell you instead that the
plausible range is genuinely wide, and reality could easily be pushed to either
of those extremes. Asking an epidemic modeler to report estimates with precise,
certain outcomes is akin to asking Lorelai Gilmore to give up coffee. It’s just not going to happen. In fact, those uncertainties should bolster, rather than undermine, your
confidence in any models.
While embracing the uncertainty in models, I hope you’re also convinced that models should be interpreted according to their aims. Often, I hear people read a projection scenario, then compare its outputs to things that later actually arose; they see a mismatch between those as evidence that the model was faulty. But projections are not forecasts and should not be assessed as if they were. In fact, a mis-alignment between a projection and the eventual reality often provides evidence that the projection served its very purpose. For example, the lead author of a prominent model produced by a team at Imperial College recently testified before the British Parliament. Some people incorrectly interpreted that testimony to undermine the model’s projections. In fact, it justified the social distancing interventions that were motivated by that model. That’s what all projection modelers hope for—that their models can be leveraged to implement meaningful changes, not that they accurately predict the future. In other words, all models should be judged on their aims.
How do models work?
Models consist of three basic parts:
- A set of outputs
- A model engine or mechanics
- A set of inputs
This list is inverted from the process that
produces models (inputs, mechanics, then outputs),
but it better reflects how those reading about models for the first time are
likely to approach them. As noted above, the model outputs are generally what
are reported from any model. Next, I want to dive into the mechanics of how
different types of models work and the different types of “engines” they rely
upon. Then we’ll close with the importance of model inputs (and the
uncertainties in those).
If the inputs are the “raw materials” of what goes into a model, and the outputs are what it produces, the mechanics of models are the processes that convert inputs into outputs. Each of the modeling aims described above can be estimated with a variety of modeling “engines.” Just as different types of engines (e.g., internal or external combustion) make vehicles move, so there are different primary frameworks for building epidemiological models. Moreover, the internal mechanics used within each model type can differ as well, similar to the ways that a single type of engine can rely on different types of fuel (e.g., gas vs. diesel), or internal motion (e.g., reciprocating vs. rotary). Here, I focus only on a subset of these possibilities, representing three primary dimensions that differentiate between the most common models being used to explain/project/forecast COVID-19 outcomes:
- Compartmental vs. Individually-oriented models
- Deterministic vs. Stochastic processes
- Curve-fitting approaches
Compartmental vs. Agent-Based Models
In epidemiology, one of the most common model forms is a type of compartmental model known as the SEIR model (susceptible, exposed, infectious, recovered).[2] In a compartmental model, every person can be in only one state (or compartment, hence the name) at a time. The model parameters (see discussion of inputs below) specify the likelihood of transitions between compartments, which are applied to everyone within a compartment in exactly the same way. These transitions between model compartments are typically estimated with sets of mathematical (differential) equations.
In contrast to compartmental models, agent-based models (ABMs) are individually-oriented. Rather than applying rules to groups of individuals within a compartment uniformly, in an ABM each individual agent is modeled explicitly. Agents are assigned characteristics and probabilities of acting in certain ways, according to those characteristics. Those characteristics can be based on similar properties to the compartments and transitions of the SEIR model, or can be based on other attributes (e.g., sociodemographic). ABMs model step-wise temporal processes, often with simulations that specify a series of rules designating when agents have the capacity to change, according to their assigned characteristics. ABM outcomes then represent the aggregation of these modeled processes.
Deterministic vs. Stochastic Processes
How the “transitions” in an SEIR model or “choices” of an ABM are estimated can rely on different assumptions about the nature of those processes. A deterministic process is defined only by the parameters and initial conditions of the model. That is, every time a model is estimated with the same set of conditions (e.g., population size and composition) and parameters (e.g., transition likelihoods), the model will generate exactly the same outcome. Such deterministic processes stand in contrast to stochastic processes, which are drawn from a probability distribution, with included error. That is, instead of specifying the precise transition probabilities that will be produced consistently across every model instantiation, stochastic processes identify likely distributions of potential actions, that are sampled within a model. This produces variation in the estimates across each run of the model, even when using the same set of model inputs. On average, stochastic models will behave in the anticipated ways, but individual model estimates can vary substantially from those expected averages. This variation reflects reality—if a novel corona virus enters a new population through a low-mobility, high-risk, mostly un-tested population as found in a nursing home, the projected outbreak scenarios are substantially different than when it enters a population that with concentrated testing and tracing efforts, such as Jeju, ROK.
Curve-Fitting Approaches
Curve-fitting is a general approach for specifying a set of mathematical expressions that best allow modelers to account for the “shape” of an epidemic’s growth curve. Once a curve is fit to existing data or specifications, it can be used to provide explanations/projections/forecasts that weren’t used in its initial formulation. Curve fitting strategies can be simple (e.g., interpolation, loess regression) or very complex (e.g., various forms of bayesian estimation). There are many ways to evaluate the fit of such models, most of which are highly technical and mathematical in how they differ, so I’ll skip that. But one core difference is whether they are parametric (i.e., relying on external predictor variables accounting for the sorts of mechanisms outlined above), or non-parametric (i.e., derived only from the information about the shape of the curve for the outcomes of interest, themselves).
How do a few of the widely reported COVID-19 models fit the descriptions above?
- Probably the most widely used model from a team at Imperial College, led by Neil Ferguson, used a combination of stochastic compartmental models and ABMs.
- Colorado’s response, has largely been informed by an SEIR model.
- The LSHTM-CMMID team used an age-structured SEIR model.
- A collaborative team, including researchers from Northeastern University that’s among those informing the White House task force is primarily using an ABM.
- The IHME model from the University of Washington is primarily a curve-fitting approach.
Where does model uncertainty come from?
When modelers report the outcomes generated
by their models, uncertainty can arise from a number of sources. As mentioned
above, stochastic estimation incorporates uncertainty directly into the model’s
mechanics, but there are numerous other forms of uncertainty in COVID-19
models.
Model inputs typically include the initial conditions (e.g., how many people are being modeled, the distribution of sociodemographic characteristics among members of that population) and parameters (e.g., the expected rates of contact between susceptible and infectious members of a population, the likelihood of transmission in each of those contacts, how long someone remains exposed but not infectious, or how likely an infected individual is to recover or die). Ideally each of these conditions and parameters for the model can be informed by other vetted empirical estimates, but those estimates are often difficult to pin down, and sometimes must be input as a range of plausible “best guesses.” Early in this pandemic, for example, we had little evidence to work with on how quickly people recover.[3] Even the best empirical estimates of these conditions and parameters are going to come with some amounts of uncertainty;[4] which propagate through each of the modeling steps that rely on these inputs.
Other
sources of uncertainty are directly relevant to our ability to estimate such
models. Perhaps the most important of these is that “confirmed case counts” are
likely a severe
under-count, as are COVID-attributed deaths.
Finally, projections and forecasts in particular must be able to incorporate
the effects of intervention efforts. It’s often hard to estimate how readily
policies will translate into actual behavior changes, how
those changes will alter the parameters included
in models, and how reasonable are the necessary assumptions to design such scenario estimates.
Hopefully this has helped you understand a little bit of why models appear so different and why the uncertainty in them is important. And just maybe, with these tools, any new models you (and I) encounter can help provide us with a little more clarity in these uncertain times.
* I’d like to thank Carl
Bergstrom, Ana Gomez, and Michelle
Poulin for helpful comments on drafts
of this piece.
[1] Different
disciplines sometimes use these labels in substantially different ways (e.g.,
some literally flipping the way I use “projections” and “forecasts”). What you
should take away from this discussion is the varied aims, not the terms I use
to represent those aims.
[2] Susceptible individuals are those who could potentially become infected, but are not currently. [There are often individuals with “natural immunity” to many viruses (not because they’ve had it previously, but because of genetic variability or other reasons). I haven’t seen any estimates of whether/how common this is with SARS-COV-2. Moreover, we’re still not certain how long immunity will last for those who have been exposed.] In SEIR terms, those who are exposed are carriers of the virus who are not yet infectious. Infectious individuals are those who have the virus and are capable of spreading it to others. People then can recover from an infection when they develop immunity to it, or could be removed from the population (e.g., through death). Recovery or removal are treated as similar states in SEIR models (because they are neither susceptible, exposed, nor infectious, so no longer contribute to the production of new cases.
[4] One reason for this is many of the best sources for these estimates are outputs from previous explanatory models.
[3] Additionally, these parameters may vary across settings in ways that are hard to estimate. For example, different population sizes and densities can change how likely susceptible individuals are to come in contact with those who are infectious, or different behavioral norms or physiological immunity patterns between locations can alter how likely those who have been exposed are to become infectious.